Creating the data source
Requirements
- Minimum access of Ad account analyst to the accounts that will be connected
Instructions
- On the Kondado platform, click on CREATE + > Connector > and select the TikTok Ads connector
- Click on “Sign in with TikTok”

- ATTENTION: In addition to popup blockers, some antivirus programs may also prevent the “Sign in with TikTok” button from appearing. So, if you're already using Chrome in an incognito window and the button still doesn't show up, temporarily disable your antivirus and reload the page for the button to appear. Reactivate your antivirus after completing the process
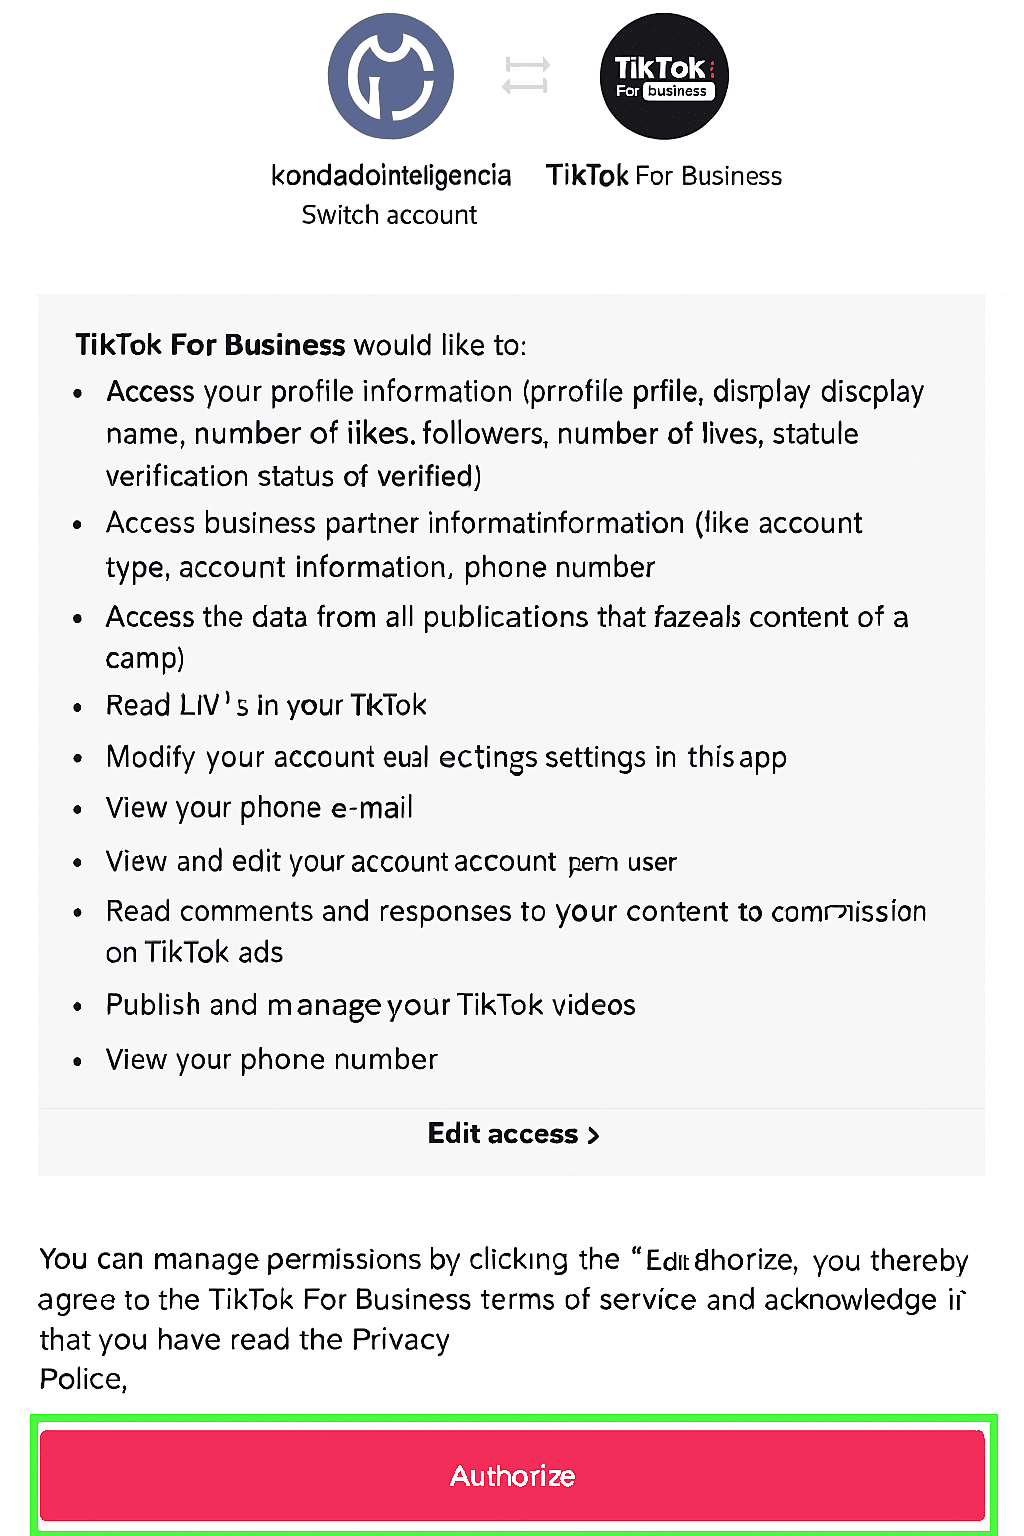
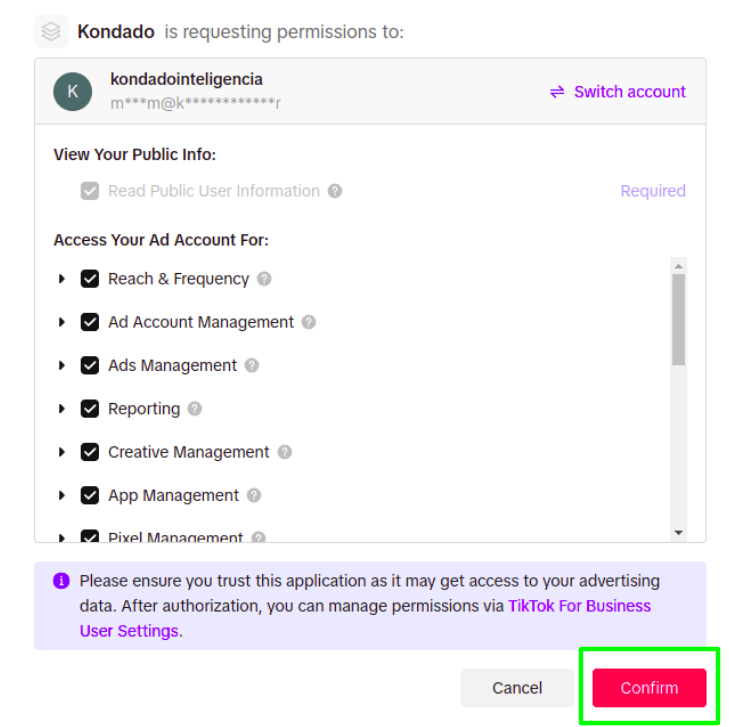
- You’ll now be redirected to a TikTok login page, where you'll need to enter your credentials. After logging in with your TikTok account linked to your TikTok Ads account, you’ll need to grant permission to Kondado
- On the permissions page, leave all options set to “Yes” and click “Complete”
- Now just save the connector
To make the best use of your integrations, learn more about breakdowns, metrics, periods, and update windows
Pipelines
Summary
Relationship chart
Click to expand

Ad Group Report
Dynamic fields: The fields in this integration are dynamically generated based on the chosen period and breakdown parameters. The map below shows only placeholder fields for reference. To see the complete list of available metrics and attributes, see the Metrics and Attributes section in the connector documentation.
Replication type: Incremental with update window
Parameters:
- Advertisers: Advertisers. Leave empty to fetch all advertisers from the data source
- Update window: How many days prior to the savepoint should the same date keep being refreshed
- Period: Time granularity of the report
- Read start date (Savepoint): Initial report date
- Breakdown: Dimensions to breakdown the report
Ad Report
Dynamic fields: The fields in this integration are dynamically generated based on the chosen period and breakdown parameters. The map below shows only placeholder fields for reference. To see the complete list of available metrics and attributes, see the Metrics and Attributes section in the connector documentation.
Replication type: Incremental with update window
Parameters:
- Advertisers: Advertisers. Leave empty to fetch all advertisers from the data source
- Update window: How many days prior to the savepoint should the same date keep being refreshed
- Period: Time granularity of the report
- Read start date (Savepoint): Initial report date
- Breakdown: Dimensions to breakdown the report
Advertiser Report
Dynamic fields: The fields in this integration are dynamically generated based on the chosen period and breakdown parameters. The map below shows only placeholder fields for reference. To see the complete list of available metrics and attributes, see the Metrics and Attributes section in the connector documentation.
Replication type: Incremental with update window
Parameters:
- Advertisers: Advertisers. Leave empty to fetch all advertisers from the data source
- Update window: How many days prior to the savepoint should the same date keep being refreshed
- Period: Time granularity of the report
- Read start date (Savepoint): Initial report date
- Breakdown: Dimensions to breakdown the report
Campaign Report
Dynamic fields: The fields in this integration are dynamically generated based on the chosen period and breakdown parameters. The map below shows only placeholder fields for reference. To see the complete list of available metrics and attributes, see the Metrics and Attributes section in the connector documentation.
Replication type: Incremental with update window
Parameters:
- Advertisers: Advertisers. Leave empty to fetch all advertisers from the data source
- Update window: How many days prior to the savepoint should the same date keep being refreshed
- Period: Time granularity of the report
- Read start date (Savepoint): Initial report date
- Breakdown: Dimensions to breakdown the report
Metadata: Ad groups
This pipeline is free
Replication type: Full
Parameters:
- Advertisers: Advertisers. Leave empty to fetch all advertisers from the data source
Relationships:
Main object
Detailed information about TikTok Ads ad groups.
| Campo | Tipo | |
|---|---|---|
|
text |
[en] Unique identifier of the ad group. |
|
|
text |
[en] App profile page state for the ad group. |
|
|
text |
[en] Ad group name. |
|
|
text |
[en] Unique identifier of the advertiser in TikTok Ads. |
|
|
text |
[en] Targeted age groups. |
|
|
text |
[en] URL of the promoted app for download. |
|
|
text |
[en] Identifier of the promoted application. |
|
|
text |
[en] Type of promoted application. |
|
|
text |
[en] IDs of audiences targeted by the campaign. |
|
|
boolean |
[en] Indicates whether automatic keyword addition is enabled. |
|
|
text |
[en] Bid display mode (e.g., CPMV). |
|
|
text |
[en] Bid price set for the ad group. |
|
|
text |
[en] Configured bid type (e.g., BID_TYPE_CUSTOM). |
|
|
text |
[en] Associated billing event (e.g., CPM, CPC). |
|
|
float |
[en] Identifier of the brand safety partner. |
|
|
text |
[en] Brand safety level applied to inventory (e.g., STANDARD_INVENTORY). |
|
|
float |
[en] Budget allocated for the ad group. |
|
|
text |
[en] Configured budget mode (e.g., BUDGET_MODE_INFINITE). |
|
|
text |
[en] Unique identifier of the associated campaign. |
|
|
text |
[en] Advertising campaign name. |
|
|
text |
[en] IDs of excluded categories. |
|
|
text |
[en] Identifier of the category associated with the ad group. |
|
|
boolean |
[en] Indicates if comments are disabled for the ad. |
|
|
text |
[en] Contextual tag IDs for ad targeting. |
|
|
text |
[en] Bid price configured for conversion. |
|
|
text |
[en] Conversion window used for attribution. |
|
|
timestamp |
[en] Date and time when the ad group was created. |
|
|
text |
[en] Creative material mode used (e.g., CUSTOM). |
|
|
text |
[en] Dayparting configuration for ad delivery times. |
|
|
text |
[en] Bid type configured for deep funnel optimization. |
|
|
text |
[en] Bid set for deep funnel CPA optimization. |
|
|
text |
[en] Event source used in deep funnel optimization. |
|
|
text |
[en] Event source ID for deep funnel optimization. |
|
|
text |
[en] Deep funnel optimization event. |
|
|
text |
[en] Status of deep funnel optimization. |
|
|
text |
[en] Ad delivery mode. |
|
|
text |
[en] List of targeted device model identifiers. |
|
|
text |
[en] Price ranges of targeted devices. |
|
|
text |
[en] IDs of audiences excluded from targeting. |
|
|
text |
[en] Type of feed where the ad will be displayed. |
|
|
float |
[en] Ad frequency cap (maximum impressions per user). |
|
|
float |
[en] Scheduled frequency interval (in days). |
|
|
text |
[en] Gender targeting (e.g., GENDER_UNLIMITED). |
|
|
text |
[en] Targeted household income brackets. |
|
|
text |
[en] IDs of interest categories used for targeting. |
|
|
text |
[en] Interest keyword IDs for targeting. |
|
|
boolean |
[en] Indicates whether inventory filtering is enabled. |
|
|
text |
[en] Quota type related to iOS 14 restrictions. |
|
|
boolean |
[en] Indicates whether the ad falls into HFSS category (high in fat, salt, sugar). |
|
|
boolean |
[en] Indicates whether the ad group follows the new structure. |
|
|
boolean |
[en] Indicates if this is a smart performance campaign. |
|
|
text |
[en] IDs of targeted internet service providers (ISPs). |
|
|
text |
[en] Keywords associated with the ad’s targeting. |
|
|
text |
[en] Languages targeted by the ad group. |
|
|
text |
[en] List of targeted geographic location identifiers. |
|
|
timestamp |
[en] Date and time of the last modification to the ad group. |
|
|
text |
[en] Network types where the ad will appear (e.g., TikTok, TikTok Search). |
|
|
float |
[en] Estimated next day retention rate. |
|
|
text |
[en] Targeted operating systems (e.g., ANDROID, IOS). |
|
|
text |
[en] Operation status of the ad group (e.g., ENABLE). |
|
|
text |
[en] Associated optimization event. |
|
|
text |
[en] Optimization goal set (e.g., REACH). |
|
|
text |
[en] Budget pacing mode (e.g., PACING_MODE_SMOOTH). |
|
|
text |
[en] Pixel ID associated with the ad group. |
|
|
text |
[en] Type of placement where the ad will be shown. |
|
|
text |
[en] Placements where the ad will appear (e.g., PLACEMENT_TIKTOK). |
|
|
text |
[en] Promotion type (e.g., WEBSITE_OR_DISPLAY). |
|
|
float |
[en] Number of impressions purchased. |
|
|
float |
[en] Purchased reach for the ad group. |
|
|
text |
[en] Estimated CPR (Cost per Result) calculated by the Reach & Frequency tool. |
|
|
float |
[en] Estimated frequency of the Reach & Frequency purchase. |
|
|
text |
[en] Reach & Frequency purchase type. |
|
|
text |
[en] ID of the saved audience used in the campaign. |
|
|
timestamp |
[en] Scheduled end date and time of the campaign. |
|
|
boolean |
[en] Indicates if the schedule is saved as draft. |
|
|
text |
[en] Unique identifier of the schedule. |
|
|
timestamp |
[en] Scheduled start date and time of the campaign. |
|
|
text |
[en] Ad scheduling type (e.g., SCHEDULE_START_END). |
|
|
float |
[en] Scheduled budget for the ad group. |
|
|
boolean |
[en] Indicates if showing in search results is enabled. |
|
|
text |
[en] Secondary event configured for optimization. |
|
|
text |
[en] Current secondary status of the ad group. |
|
|
boolean |
[en] Indicates whether sharing is disabled. |
|
|
boolean |
[en] Indicates if learning phase is skipped. |
|
|
boolean |
[en] Indicates if smart audience targeting is enabled. |
|
|
boolean |
[en] Indicates if smart interest behavior targeting is enabled. |
|
|
text |
[en] Targeted spending power segment (e.g., ALL, HIGH). |
|
|
text |
[en] Type of statistic used in reporting or targeting. |
|
|
text |
[en] Specific subplacements within TikTok where ads will be shown (e.g., IN_FEED, SEARCH_FEED). |
|
|
text |
[en] Value-based optimization window (VBO window). |
|
|
text |
[en] Vertical sensitivity ID for content restrictions. |
|
|
boolean |
[en] Indicates whether video download is disabled. |
tiktokads_adgroup_details_actions
Configured actions for each ad group.
| Campo | Tipo | |
|---|---|---|
|
text |
[en] Unique identifier of the ad group. |
|
|
text |
[en] IDs of the applied action categories. |
|
|
float |
[en] Time period considered for the action, in days. |
|
|
text |
[en] Scene or context where the action occurred (e.g., VIDEO_RELATED). |
|
|
text |
[en] User actions on videos (e.g., WATCHED_TO_END, LIKED). |
tiktokads_adgroup_details_excluded_custom_actions
Custom actions excluded per ad group.
| Campo | Tipo | |
|---|---|---|
|
text |
[en] Unique identifier of the ad group. |
|
|
text |
[en] Code of the excluded custom action. |
|
|
float |
[en] Number of days the excluded custom action is considered. |
tiktokads_adgroup_details_schedule_infos_schedules
Ad group schedule entries defining serving times.
| Campo | Tipo | |
|---|---|---|
|
text |
[en] Unique identifier of the ad group. |
|
|
timestamp |
[en] Scheduled end time for ad delivery. |
|
|
text |
[en] Expected orders during the scheduled period. |
|
|
timestamp |
[en] Scheduled start time for ad delivery. |
tiktokads_adgroup_details_included_custom_actions
Custom actions included for each ad group.
Metadata: Ads
This pipeline is free
Replication type: Full
Parameters:
- Advertisers: Advertisers. Leave empty to fetch all advertisers from the data source
Relationships:
Main object
Detailed metadata for creatives configured in TikTok Ads.
| Campo | Tipo | |
|---|---|---|
|
text |
[en] Ad ID |
|
|
text |
[en] Ad format |
|
|
text |
[en] Advertiser ID |
|
|
text |
[en] Ad name |
|
|
text |
[en] Campaign ID |
|
|
text |
[en] Campaign name |
|
|
text |
[en] Ad text |
|
|
text |
[en] Ad texts |
|
|
text |
[en] Ad group ID |
|
|
text |
[en] Ad group name |
|
|
text |
[en] AIGC disclosure type |
|
|
text |
[en] App name |
|
|
text |
[en] Avatar icon web URI |
|
|
text |
[en] Brand safety postbid partner |
|
|
text |
[en] Brand safety VAST URL |
|
|
text |
[en] Call to action |
|
|
text |
[en] Call to action ID |
|
|
text |
[en] Card ID |
|
|
text |
[en] Carousel image labels |
|
|
text |
[en] Click tracking URL |
|
|
timestamp |
[en] Create time |
|
|
boolean |
[en] Creative authorized |
|
|
text |
[en] Creative type |
|
|
text |
[en] Deeplink |
|
|
text |
[en] Deeplink type |
|
|
text |
[en] Display name |
|
|
text |
[en] Identity ID |
|
|
text |
[en] Identity type |
|
|
text |
[en] Image IDs |
|
|
text |
[en] URL of the first image/thumbnail of the ad. WARNING: This URL expires in 1 hour. See tiktokads_ad_details_images table for all images. |
|
|
text |
[en] Direct MP4 video download URL for the ad. WARNING: This URL expires according to preview_url_expire_time. |
|
|
timestamp |
[en] Expiration timestamp for preview_url. The video URL expires after this time. |
|
|
text |
[en] Impression tracking URL |
|
|
boolean |
[en] Is ACO (Automated Creative Optimization) |
|
|
boolean |
[en] Is new structure |
|
|
text |
[en] Landing page URL |
|
|
text |
[en] Landing page URLs |
|
|
timestamp |
[en] Modify time |
|
|
text |
[en] Music ID |
|
|
text |
[en] Operation status |
|
|
text |
[en] Optimization event |
|
|
text |
[en] Page ID |
|
|
text |
[en] Playable URL |
|
|
text |
[en] Profile image URL |
|
|
text |
[en] Secondary status |
|
|
text |
[en] Tracking pixel ID |
|
|
boolean |
[en] VAST Moat enabled |
|
|
text |
[en] Video ID |
|
|
text |
[en] Organic TikTok video ID (used in Spark Ads). Different from video_id (Asset Library). |
|
|
text |
[en] Permanent URL to the ad video on TikTok. Format: https://www.tiktok.com/@{display_name}/video/{tiktok_item_id}. Available only for Spark Ads. |
|
|
text |
[en] Viewability postbid partner |
|
|
text |
[en] Viewability VAST URL |
tiktokads_ad_details_utm_params
UTM parameter key/value pairs associated with each ad.
| Campo | Tipo | |
|---|---|---|
|
text |
[en] Ad ID |
|
|
text |
[en] Advertiser ID |
|
|
text |
[en] Ad name |
|
|
text |
[en] Campaign ID |
|
|
text |
[en] Campaign name |
|
|
text |
[en] Ad group ID |
|
|
text |
[en] Ad group name |
|
|
text |
[en] UTM parameter key |
|
|
text |
[en] UTM parameter value |
tiktokads_ad_details_images
Ad image/thumbnail URLs. WARNING: URLs expire 1 hour after extraction.
Metadata: Campaigns
This pipeline is free
Replication type: Full
Parameters:
- Advertisers: Advertisers. Leave empty to fetch all advertisers from the data source
Configuration and attributes for TikTok Ads campaigns.
| Campo | Tipo | |
|---|---|---|
|
text |
[en] Campaign ID |
|
|
text |
[en] Advertiser ID |
|
|
text |
[en] App ID |
|
|
text |
[en] App Promotion Type |
|
|
text |
[en] Bid Align Type |
|
|
float |
[en] Budget |
|
|
text |
[en] Budget Mode |
|
|
boolean |
[en] Budget Optimize On |
|
|
text |
[en] Campaign App Profile Page State |
|
|
text |
[en] Campaign Name |
|
|
text |
[en] Campaign Product Source |
|
|
text |
[en] Campaign System Origin |
|
|
text |
[en] Campaign Type |
|
|
boolean |
[en] Catalog Enabled |
|
|
timestamp |
[en] Create Time |
|
|
text |
[en] Deep Bid Type |
|
|
boolean |
[en] Disable SKAN Campaign |
|
|
boolean |
[en] Is Advanced Dedicated Campaign |
|
|
boolean |
[en] Is New Structure |
|
|
boolean |
[en] Is Search Campaign |
|
|
boolean |
[en] Is Smart Performance Campaign |
|
|
timestamp |
[en] Modify Time |
|
|
text |
[en] Objective |
|
|
text |
[en] Objective Type |
|
|
text |
[en] Operation Status |
|
|
text |
[en] Optimization Goal |
|
|
text |
[en] Postback Window Mode |
|
|
text |
[en] RF Campaign Type |
|
|
text |
[en] ROAS Bid |
|
|
text |
[en] RTA Bid Enabled |
|
|
text |
[en] RTA ID |
|
|
boolean |
[en] RTA Product Selection Enabled |
|
|
text |
[en] Sales Destination |
|
|
text |
[en] Secondary Status |
|
|
text |
[en] Special Industries |
|
|
text |
[en] Virtual Objective Type |
Notes
Breakdown
All breakdowns of a report segment a dataset into smaller groups. Using breakdowns other than the ID of the entity to be read limits the number of metrics in the report
- campaign_id: Group by Campaign ID
- adgroup_id: Group by Ad Group ID
- ad_id: Group by Ad ID
- advertiser_id: Group by Advertiser ID
- stat_time_day: Group by day
- gender: Group by gender
- age: Group by age
- country_code: Group by location code.
- province_id: Group by location ID.
- dma_id: Group by Designated Market Area (DMA). Only U.S. has DMAs.
- ac: Group by audience network
- language: Group by audience language
- platform: Grouped by operating system
- interest_category: Group by first_level interest category
- interest_category_tier2: Group by second_level interest category
- interest_category_tier3: Group by third_level interest category
- interest_category_tier4: Group by fourth_level interest category
- behavior_id: Group by behavior
- placement: Group by placement
- device_brand_id: Group by device brand.
Metrics and Attributes
According to the choices made for period and breakdown parameters, your report will include different metrics and attributes.
Attributes
Attributes are included in your report according to the selected breakdown
- campaign_id: Group by Campaign ID
- adgroup_id: Group by Ad Group ID
- ad_id: Group by Ad ID
- advertiser_id: Group by Advertiser ID
- stat_time_day: Group by day
- stat_time_hour: Group by hour
- gender: Group by gender
- age: Group by age
- country_code: Group by location code.
- province_id: Group by location ID.
- dma_id: Group by Designated Market Area (DMA). Only U.S. has DMAs.
- ac: Group by audience network
- language: Group by audience language
- platform: Grouped by operating system
- interest_category: Group by first_level interest category
- interest_category_tier2: Group by second_level interest category
- interest_category_tier3: Group by third_level interest category
- interest_category_tier4: Group by fourth_level interest category
- behavior_id: Group by behavior
- placement: Group by placement.
- device_brand_id: Group by device brand. When this dimension is used, lifetime cannot be true.
Metrics
There are 2 types of metrics: Basic and Audience
Basic metrics
Will be available in the following cases:
- Reservation reports
- Reports using Hourly or Lifetime period
- Reports using aggregation by entity ID. For example, an Ads report with breakdown by ad_id
General metrics
- initiate_checkout_rate: Unique checkout start rate (web). The percentage of checkout start actions on the page relative to all clicks attributed to your ads
- cost_per_app_event_add_to_cart: Unique cost per add to cart (app). The average cost per unique add to cart action in the app attributed to your ads
- sales_lead: Unique leads generated (app). Number of unique lead generation actions in the app attributed to your ads
- shares: Paid shares. Number of shares of your ad during its impression
- cost_per_web_event_add_to_cart: Cost per add to cart (web). Average cost per add to cart action on the web attributed to your ads
- vta_app_install: VTA app install. Number of app install events attributed to an ad impression
- total_add_to_wishlist_value: Add to wishlist value (app). Total value of add to wishlist actions in the app attributed to your ads
- product_details_page_browse: Product detail page views. Number of product detail page view events
- web_event_add_to_cart_rate: Add to cart rate (web). Percentage of add to cart actions on the page relative to all clicks attributed to your ads
- purchase_rate: Unique purchase rate (app). Percentage of purchase actions in the app relative to all app installs attributed to your ads
- value_per_total_purchase: Value per purchase (app). Average value per purchase action in the app attributed to your ads
- cost_per_total_app_event_add_to_cart: Cost per add to cart (app). Average cost per add to cart action in the app attributed to your ads
- total_user_registration_value: User registration value (web). Total value of registration completion actions on the page attributed to your ads
- cost_per_user_registration: Cost per registration (web). Average cost per registration completion action on the page attributed to your ads
- web_event_add_to_cart: Add to carts (web). Number of add to cart actions on the web attributed to your ads
- user_registration: Completed registrations (web). Number of registration completion actions on the web attributed to your ads
- total_initiate_checkout_value: Checkout initiation value (web). Total value of checkout start actions on the page attributed to your ads
- real_time_cost_per_conversion: Real-time cost per conversion. Average amount spent per conversion
- app_event_add_to_cart: Unique add to carts (app). Number of unique add to cart actions in the app attributed to your ads
- initiate_checkout: Checkouts started (web). Number of checkout start actions on the web attributed to your ads
- app_event_add_to_cart_rate: Add to cart rate (app). Percentage of add to cart actions in the app relative to all installs attributed to your ads
- registration_rate: Unique registration rate (app). Percentage of registration actions in the app relative to all installs attributed to your ads
- total_purchase: Purchases (app). Number of purchase actions in the app attributed to your ads
- complete_payment: Completed payments (web). Number of payment completion actions on the web attributed to your ads
- follows: Paid follows. Number of profile follows during the ad's impression
- cost_per_total_view_content: Cost per content view (app). Average cost per content view action in the app attributed to your ads
- cost_per_add_to_wishlist: Unique cost per add to wishlist (app). Average cost per unique add to wishlist action in the app attributed to your ads
- video_watched_6s: 6-second video views. Number of times your video was played for at least 6 seconds. Each video impression counts separately, and replays are excluded
- cost_per_result: Cost per result. Average cost per result from your ads
- total_product_details_page_browse_value: Total product detail page view value. Total returned value from product detail page view events
- likes: Paid likes. Number of times your ad was liked during its impression
- cta_app_install: CTA app install. Number of app install events attributed to a click on your ad
- total_active_pay_roas: Purchase ROAS (app). Return on ad spend (ROAS) from purchase actions in the app
- vta_registration: VTA registration. Number of registration events attributed to impression, based on data from your measurement partner
- registration: Unique registrations (app). Number of unique registration actions in the app attributed to your ads
- profile_visits: Paid profile visits. Number of visits to the associated profile during the ad’s impression
- frequency: Frequency. Average number of times each user saw your ad during a given period
- real_time_conversion_rate_v2: Real-time conversion rate (CVR). Percentage of conversions received from all ad impressions
- cta_registration: CTA registration. Number of app registration events attributed to a click, based on data from your measurement partner
- impressions: Impressions. Number of times your ads were shown
- cost_per_cta_purchase: Cost per CTA purchase. Average cost for each payment event attributed to clicks
- cost_per_view_content: Unique cost per content view (app). Average cost per unique content view action in the app attributed to your ads
- comments: Paid comments. Number of comments made on your ad during its impression
- view_content_rate: Unique content view rate (app). Percentage of content view actions in the app relative to all installs attributed to your ads
- cost_per_total_checkout: Cost per checkout (app). Average cost per checkout action in the app attributed to your ads
- complete_payment_rate: Unique payment completion rate (web). Percentage of payment completion actions on the web relative to all clicks attributed to your ads
- value_per_initiate_checkout: Value per checkout initiated (web). Average value per checkout start action on the web attributed to your ads
- total_sales_lead_value: Lead generation value (app). Total value of lead generation actions in the app attributed to your ads
- cost_per_1000_reached: Cost per 1,000 people reached. Average cost to reach 1,000 unique users
- total_add_to_wishlist: Add to wishlist actions (app). Number of add to wishlist actions in the app attributed to your ads
- video_views_p25: 25% video views. Number of times your video was watched for at least 25% of its duration. Each impression is counted separately; replays are excluded
- vta_conversion: VTA conversion. Number of conversion events attributed to an ad impression
- cost_per_vta_conversion: Cost per VTA conversion. Average cost for each conversion event attributed to an ad impression
- cost_per_complete_payment: Cost per completed payment (web). Average cost for each payment completion action on the web attributed to your ads
- ctr: CTR (destination). Percentage of impressions that resulted in a click to the destination relative to all impressions
- cost_per_cta_registration: Cost per CTA registration. Average cost for each registration event in the app attributed to clicks
- total_view_content: Content views (app). Number of content view actions in the app attributed to your ads
- real_time_conversion: Real-time conversions. Number of times your ad resulted in the selected optimization event
- cta_purchase: CTA purchase. Number of payment events in the app attributed to a click, based on your measurement partner’s data
- cost_per_product_details_page_browse: Cost per product detail page view. Average cost of each product detail page view event
- total_view_content_value: Content view value (app). Total value of content view actions in the app attributed to your ads
- total_sales_lead: Leads generated (app). Number of lead generation actions in the app attributed to your ads
- value_per_total_view_content: Value per content view (app). Average value per content view action in the app attributed to your ads
- cost_per_conversion: Cost per conversion. Average amount spent per conversion
- add_to_wishlist_rate: Add to wishlist rate (app). Percentage of add to wishlist actions in the app relative to all app installs attributed to your ads
- conversion_rate: Conversion rate (CVR, clicks). Percentage of results received from all clicks to the destination of your ads. Note: as of the end of October 2023, this metric’s logic will be updated to be based on impressions – same as conversion_rate_v2
- real_time_cost_per_result: Real-time cost per result. Average cost per result from your ads
- video_views_p50: 50% video views. Number of times your video was watched for at least 50% of its duration. Each impression is counted separately; replays are excluded
- cost_per_checkout: Unique cost per checkout (app). Average cost per unique checkout action in the app attributed to your ads
- value_per_web_event_add_to_cart: Value per add to cart (web). Average value per add to cart action on the web attributed to your ads
- real_time_result: Real-time results. Number of times your ad resulted in the intended outcome based on the campaign goal and optimization target
- video_views_p100: 100% video views. Number of times your video was watched through 100% of its duration. Each impression is counted separately; replays are excluded
- total_web_event_add_to_cart_value: Add to cart value (web). Total value of add to cart actions on the web attributed to your ads
- cta_conversion: CTA conversion. Number of conversion events attributed to a click on your ad
- total_app_event_add_to_cart: Add to cart actions (app). Number of add to cart actions in the app attributed to your ads
- checkout: Unique checkouts (app). Number of unique checkout actions in the app attributed to your ads
- product_details_page_browse_rate: Product detail page view rate (%). Percentage of product detail page views relative to all click events
- total_checkout: Checkouts (app). Number of checkout actions in the app attributed to your ads
- value_per_total_app_event_add_to_cart: Value per add to cart (app). Average value per add to cart action in the app attributed to your ads
- user_registration_rate: Registration completion rate (web). Percentage of registration completion actions on the web relative to all clicks attributed to your ads
- total_app_event_add_to_cart_value: Add to cart value (app). Total value of add to cart actions in the app attributed to your ads
- cost_per_total_add_to_wishlist: Cost per add to wishlist (app). Average cost per add to wishlist action in the app attributed to your ads
- cost_per_initiate_checkout: Cost per checkout initiated (web). Average cost per checkout start action on the web attributed to your ads
- video_watched_2s: 2-second video views. Number of times your video was played for at least 2 seconds. Each impression is counted separately; replays are excluded
- total_checkout_value: Checkout value (app). Total value of checkout actions in the app attributed to your ads
- cost_per_vta_purchase: Cost per VTA purchase. Average cost for each payment event attributed to an impression
- result: Results. Number of times your ad resulted in the intended outcome based on the campaign goal and optimization target
- cost_per_registration: Unique cost per registration (app). Average cost per unique registration action in the app attributed to your ads
- cpc: CPC (destination). Average cost per click to a specified destination
- add_to_wishlist: Unique add to wishlist actions (app). Number of unique add to wishlist actions in the app attributed to your ads
- video_play_actions: Video views. Number of times your video began to play. Each impression is counted separately; replays are excluded
- total_purchase_value: Purchase value (app). Total value of purchase actions in the app attributed to your ads
- video_views_p75: 75% video views. Number of times your video was watched for at least 75% of its duration. Each impression is counted separately; replays are excluded
- value_per_user_registration: Value per registration (web). Average value per registration completion action on the web attributed to your ads
- total_complete_payment_rate: Payment completion value (web). Total value of payment completion actions on the web attributed to your ads
- value_per_checkout: Value per checkout (app). Average value per checkout action in the app attributed to your ads
- conversion: Conversions. Number of times your ad resulted in the selected optimization event
- value_per_product_details_page_browse: Value per product detail page view. Average value returned from product detail page view events
- cost_per_total_purchase: Cost per purchase (app). Average cost per purchase action in the app attributed to your ads
- value_per_complete_payment: Value per completed payment (web). Average value per payment completion action on the web attributed to your ads
- cost_per_vta_registration: Cost per VTA registration. Average cost for each registration event attributed to impression
- clicks: Clicks (destination). Number of clicks from your ads to a specified destination
- value_per_total_add_to_wishlist: Value per add to wishlist (app). Average value per add to wishlist action in the app attributed to your ads
- reach: Reach. Number of unique users who viewed your ads at least once
- cost_per_purchase: Unique cost per purchase (app). Average cost per unique purchase action in the app attributed to your ads
- average_video_play: Average playback time per video view. Average time your video was watched per unique view, including rewatch time
- purchase: Unique purchases (app). Number of unique purchase actions in the app attributed to your ads
- cost_per_total_registration: Cost per registration (app). Average cost per registration action in the app attributed to your ads
- checkout_rate: Unique checkout rate (app). Percentage of checkout actions in the app relative to all installs attributed to your ads
- cpm: CPM. Average amount spent per 1,000 impressions
- total_registration: Registrations (app). Number of registration actions in the app attributed to your ads
- result_rate: Result rate. Percentage of results that occurred in relation to all impressions of your ads
- view_content: Unique content views (app). Number of unique content view actions in the app attributed to your ads
- vta_purchase: VTA purchase. Number of payment events in the app attributed to an impression, based on your measurement partner’s data
- real_time_result_rate: Real-time result rate. Percentage of results that occurred in relation to all impressions of your ads
- spend: Cost. Sum of your total ad spend
- onsite_purchases_roas: Onsite purchases ROAS. The return on ad spend for onsite purchases
- onsite_total_purchase: Total onsite purchases. The total number of onsite purchase events attributed to your ads
- onsite_cost_per_purchase: Cost per onsite purchase. The average cost per onsite purchase event
- onsite_purchase_rate: Onsite purchase rate. The percentage of impressions that resulted in an onsite purchase
- onsite_value_per_purchase: Value per onsite purchase. The average value of each onsite purchase event
- onsite_total_purchase_value: Total onsite purchase value. The total monetary value of all onsite purchases
- onsite_total_checkout_initiation: Total onsite checkout initiations
- onsite_cost_per_checkout_initiation: Cost per onsite checkout initiation
- onsite_checkout_initiation_rate: Onsite checkout initiation rate
- onsite_value_per_checkout_initiation: Value per onsite checkout initiation
- onsite_total_checkout_initiation_value: Total onsite checkout initiation value
- onsite_total_add_to_cart: Total onsite add to cart
- onsite_cost_per_add_to_cart: Cost per onsite add to cart
- onsite_add_to_cart_rate: Onsite add to cart rate
- onsite_value_per_add_to_cart: Value per onsite add to cart
- onsite_total_add_to_cart_value: Total onsite add to cart value
- onsite_total_product_details_page_view: Total onsite product details page views
- onsite_cost_per_product_details_page_view: Cost per onsite product details page view
- onsite_product_details_page_view_rate: Onsite product details page view rate
- onsite_value_per_product_details_page_view: Value per onsite product details page view
- onsite_total_product_details_page_view_value: Total onsite product details page view value
- onsite_total_filtered_out_form_submission: Total onsite filtered out form submissions
- shop_total_purchase_by_order_submission: Total shop purchases by order submission on TikTok Shop
- shop_gross_revenue_by_order_submission: Shop gross revenue by order submission on TikTok Shop
- shop_total_items_purchased: Total shop items purchased on TikTok Shop
- offline_total_crm_events: Total offline CRM events
- offline_cost_per_crm_event: Cost per offline CRM event
- offline_crm_event_rate: Offline CRM event rate
- offline_value_per_crm_event: Value per offline CRM event
- offline_crm_event_value: Offline CRM event value
- offline_preferred_leads: Offline preferred leads
- offline_cost_per_preferred_lead: Cost per offline preferred lead
- offline_preferred_lead_rate: Offline preferred lead rate
- offline_total_find_location: Total offline find location
- offline_cost_per_find_location: Cost per offline find location
- offline_find_location_rate: Offline find location rate
- offline_value_per_find_location: Value per offline find location
- offline_total_find_location_value: Total offline find location value
- offline_total_schedule: Total offline schedules
- offline_cost_per_schedule: Cost per offline schedule
- offline_schedule_rate: Offline schedule rate
- offline_value_per_schedule: Value per offline schedule
- offline_total_schedule_value: Total offline schedule value
- offline_total_customize_product: Total offline customize product
- offline_cost_per_customize_product: Cost per offline customize product
- offline_customize_product_rate: Offline customize product rate
- offline_value_per_customize_product: Value per offline customize product
- offline_total_customize_product_value: Total offline customize product value
- offline_total_custom_events: Total offline custom events
- offline_cost_per_custom_event: Cost per offline custom event
- offline_custom_event_rate: Offline custom event rate
- offline_value_per_custom_event: Value per offline custom event
- offline_total_custom_event_value: Total offline custom event value
- offline_contact_events: Offline contact events. The number of offline contact actions attributed to your ads
- offline_contact_event_rate: Offline contact event rate. The percentage of offline contact actions from all clicks
- offline_subscribe_events: Offline subscribe events. The number of offline subscribe actions attributed to your ads
- offline_subscribe_event_rate: Offline subscribe event rate. The percentage of offline subscribe actions from all clicks
- offline_form_events: Offline form events. The number of offline form submission actions attributed to your ads
- offline_form_event_rate: Offline form event rate. The percentage of offline form submissions from all clicks
- offline_shopping_events: Offline shopping events. The number of offline shopping actions attributed to your ads
- offline_shopping_event_rate: Offline shopping event rate. The percentage of offline shopping actions from all clicks
- cost_per_offline_shopping_event: Cost per offline purchase. Average cost per offline purchase action
- value_per_offline_shopping_event: Value per offline purchase. Average value per offline purchase action
- offline_shopping_events_value: Offline purchase value. Total value of offline purchase actions
- offline_shopping_events_roas: Offline purchase ROAS. Return on ad spend from offline purchases
- cost_per_offline_place_order_event: Cost per offline order. Average cost per offline place order action
- value_per_offline_place_order_event: Value per offline order. Average value per offline place order action
- offline_place_order_events_value: Offline orders value. Total value of offline place order actions
- cost_per_offline_contact_event: Cost per offline contact. Average cost per offline contact event
- value_per_offline_contact_event: Value per offline contact. Average value per offline contact event
- offline_contact_events_value: Offline contacts value. Total value of offline contact events
- cost_per_offline_subscribe_event: Cost per offline subscription. Average cost per offline subscribe event
- value_per_offline_subscribe_event: Value per offline subscription. Average value per offline subscribe event
- offline_subscribe_events_value: Offline subscriptions value. Total value of offline subscribe events
- cost_per_offline_form_event: Cost per offline form. Average cost per offline form submission
- value_per_offline_form_event: Value per offline form. Average value per offline form submission
- offline_form_events_value: Offline forms value. Total value of offline form submissions
- cost_per_offline_complete_registration_event: Cost per offline registration. Average cost per offline registration
- value_per_offline_complete_registration_event: Value per offline registration. Average value per offline registration
- offline_complete_registration_events_value: Offline registrations value. Total value of offline registrations
- cost_per_offline_add_to_cart_event: Cost per offline add to cart
- value_per_offline_add_to_cart_event: Value per offline add to cart
- offline_add_to_cart_events_value: Total value of offline add to cart events
- cost_per_offline_add_payment_info_event: Cost per offline payment info add
- value_per_offline_add_payment_info_event: Value per offline payment info add
- offline_add_payment_info_events_value: Total value of offline payment info adds
- cost_per_offline_add_to_wishlist_event: Cost per offline add to wishlist
- value_per_offline_add_to_wishlist_event: Value per offline add to wishlist
- offline_add_to_wishlist_events_value: Total value of offline add to wishlist events
- cost_per_offline_click_button_event: Cost per offline button click
- value_per_offline_click_button_event: Value per offline button click
- offline_click_button_events_value: Total value of offline button clicks
- cost_per_offline_download_event: Cost per offline download
- value_per_offline_download_event: Value per offline download
- offline_download_events_value: Total value of offline downloads
- cost_per_offline_initiate_checkout_event: Cost per offline checkout initiation
- value_per_offline_initiate_checkout_event: Value per offline checkout initiation
- offline_initiate_checkout_events_value: Total value of offline checkout initiations
- cost_per_offline_search_event: Cost per offline search
- value_per_offline_search_event: Value per offline search
- offline_search_events_value: Total value of offline searches
- cost_per_offline_view_content_event: Cost per offline content view
- value_per_offline_view_content_event: Value per offline content view
- offline_view_content_events_value: Total value of offline content views
- onsite_unique_purchase: Unique TikTok purchase. Number of unique purchase actions on TikTok
- onsite_cost_per_unique_purchase: Cost per unique TikTok purchase
- onsite_total_purchase_value_day0: Day 0 purchase value. Total purchase value within 24 hours
- onsite_total_purchase_value_day6: Day 6 purchase value. Total purchase value within 168 hours
- onsite_total_purchase_value_day13: Day 13 purchase value. Total purchase value within 336 hours
- onsite_total_purchase_roas_day0: Day 0 purchase ROAS. Return on ad spend from purchases within 24 hours
- onsite_total_purchase_roas_day6: Day 6 purchase ROAS. Return on ad spend from purchases within 168 hours
- onsite_unique_checkout_initiation: Unique TikTok checkout initiation
- onsite_cost_per_unique_checkout_initiation: Cost per unique TikTok checkout initiation
- onsite_unique_add_to_cart: Unique TikTok add to cart
- onsite_cost_per_unique_add_to_cart: Cost per unique TikTok add to cart
- engagements: Engagements. Number of clicks including destination clicks and social interactions
- engagement_rate: Engagement rate. Percentage of impressions that resulted in a click
- live_views: LIVE views. Number of times your LIVE was viewed from an ad
- live_unique_views: Unique LIVE views. Unique users who saw your LIVE at least once
- live_effective_views: 10-second LIVE views. Views of at least 10 seconds
- live_product_clicks: LIVE product clicks. Clicks on products during live streaming
- billed_cost: Billed cost. Total ad spend excluding credits or coupons
- cash_spend: Cash spend. Amount spent charged by cash
- voucher_spend: Voucher spend. Amount spent charged by voucher
- offline_add_to_cart_events: Offline add to cart events. The number of offline add to cart actions attributed to your ads
- offline_add_to_cart_event_rate: Offline add to cart event rate. The percentage of offline add to cart actions from all clicks
- offline_click_button_events: Offline click button events. The number of offline button click actions attributed to your ads
- offline_click_button_event_rate: Offline click button event rate. The percentage of offline button clicks from all clicks
- offline_initiate_checkout_events: Offline initiate checkout events. The number of offline checkout initiation actions attributed to your ads
- offline_initiate_checkout_event_rate: Offline initiate checkout event rate. The percentage of offline checkout initiations from all clicks
- offline_search_events: Offline search events. The number of offline search actions attributed to your ads
- offline_search_event_rate: Offline search event rate. The percentage of offline search actions from all clicks
- offline_download_events: Offline download events. The number of offline download actions attributed to your ads
- offline_download_event_rate: Offline download event rate. The percentage of offline download actions from all clicks
- offline_view_content_events: Offline view content events. The number of offline view content actions attributed to your ads
- offline_view_content_event_rate: Offline view content event rate. The percentage of offline view content actions from all clicks
- offline_add_payment_info_events: Offline add payment info events. The number of offline add payment info actions attributed to your ads
- offline_add_payment_info_event_rate: Offline add payment info event rate. The percentage of offline add payment info actions from all clicks
- offline_add_to_wishlist_events: Offline add to wishlist events. The number of offline add to wishlist actions attributed to your ads
- offline_add_to_wishlist_event_rate: Offline add to wishlist event rate. The percentage of offline add to wishlist actions from all clicks
- offline_place_order_events: Offline place order events. The number of offline order placement actions attributed to your ads
- offline_place_order_event_rate: Offline place order event rate. The percentage of offline order placements from all clicks
- offline_complete_registration_events: Offline complete registration events. The number of offline registration completions attributed to your ads
- offline_complete_registration_event_rate: Offline complete registration event rate. The percentage of offline registrations from all clicks
- onsite_shopping: Onsite shopping (TikTok Shop). The number of complete payment events on TikTok Shop
- onsite_shopping_rate: Onsite shopping rate (TikTok Shop). The percentage of shopping events from all clicks
- onsite_shopping_roas: Onsite shopping ROAS (TikTok Shop). Return on ad spend from TikTok Shop purchases
- onsite_form: Onsite form (TikTok Shop). The number of form submission events on TikTok leads generation page
- onsite_form_rate: Onsite form rate (TikTok Shop). The percentage of form submissions from all clicks
- onsite_add_to_wishlist: Onsite add to wishlist (TikTok Shop). The number of add to wishlist events on TikTok Shop
- onsite_add_to_wishlist_rate: Onsite add to wishlist rate (TikTok Shop). The percentage of add to wishlist actions from all clicks
- onsite_registration_rate: Onsite registration rate (TikTok Shop). The percentage of registration events from all clicks
- website_total_find_location: Total website find location
- website_cost_per_find_location: Cost per website find location
- website_find_location_rate: Website find location rate
- website_value_per_find_location: Value per website find location
- website_total_find_location_value: Total website find location value
- website_total_schedule: Total website schedules
- website_cost_per_schedule: Cost per website schedule
- website_schedule_rate: Website schedule rate
- website_value_per_schedule: Value per website schedule
- website_total_schedule_value: Total website schedule value
- website_total_customize_product: Total website customize product
- website_cost_per_customize_product: Cost per website customize product
- website_customize_product_rate: Website customize product rate
- website_value_per_customize_product: Value per website customize product
- website_total_customize_product_value: Total website customize product value
- day7_retention: 7-day retention. The number of unique users who returned to the app on day 7 after installation
- cost_per_day7_retention: Cost per 7-day retention
- day7_retention_rate: 7-day retention rate
- total_day7_retention: Total 7-day retention
- cost_per_total_day7_retention: Cost per total 7-day retention
- value_per_total_day7_retention: Value per total 7-day retention
- total_day7_retention_value: Total 7-day retention value
- paid_engaged_view: Paid engaged view. Views of at least 6 seconds or to the end, or with interaction
- paid_engagement_engaged_view: Paid engagement engaged view
- paid_engaged_view_15s: Paid engaged view 15s. Views of at least 15 seconds
- paid_engagement_engaged_view_15s: Paid engagement engaged view 15s
- anchor_clicks: Anchor clicks. Clicks on anchor links in the ad
- anchor_click_rate: Anchor click rate. Percentage of impressions resulting in anchor clicks
- clicks_on_hashtag_challenge: Hashtag Challenge clicks. Clicks to visit the Hashtag Challenge page
- duet_clicks: Duet clicks. Clicks on duet button during ad impression
- stitch_clicks: Stitch clicks. Clicks on stitch button during ad impression
- sound_usage_clicks: Sound usage clicks. Clicks to use the ad's sound
- tt_playlist_visit: TikTok playlist visits. Clicks to visit the TikTok playlist
- tt_playlist_visit_rate: Playlist visit rate. Percentage of impressions resulting in playlist visits
- engaged_view: Engaged view. Video views of at least 6 seconds or with interaction
- engaged_view_15s: 15-second engaged view. Video views of at least 15 seconds
- interactive_add_on_impressions: Interactive add-on impressions. Impressions of interactive elements
- interactive_add_on_destination_clicks: Interactive add-on destination clicks
- interactive_add_on_activity_clicks: Interactive add-on activity clicks
- interactive_add_on_option_a_clicks: Interactive add-on option A clicks
- interactive_add_on_option_b_clicks: Interactive add-on option B clicks
- countdown_sticker_recall_clicks: Countdown sticker recall clicks
- ix_video_views: IX video views. Video views in Instant Experience
- ix_video_views_p25: IX video views at 25%
- ix_video_views_p50: IX video views at 50%
- ix_video_views_p75: IX video views at 75%
- ix_video_views_p100: IX video views at 100%
- ix_average_video_play: IX average video play time
- secondary_goal_result: Secondary goal results
- cost_per_secondary_goal_result: Cost per secondary goal result
- secondary_goal_result_rate: Secondary goal result rate
- onsite_total_purchase_roas_day13: ROAS de compra dia 13. Retorno sobre gastos com compras em 336 horas
- onsite_total_purchase_value_calendar_day0: Valor de compra dia calendário 0
- onsite_total_purchase_value_calendar_day6: Valor de compra dia calendário 6
- onsite_total_purchase_value_calendar_day13: Valor de compra dia calendário 13
- onsite_total_purchase_roas_calendar_day0: ROAS de compra dia calendário 0
- onsite_total_purchase_roas_calendar_day6: ROAS de compra dia calendário 6
- onsite_total_purchase_roas_calendar_day13: ROAS de compra dia calendário 13
- onsite_unique_first_launch_conversion_time: Tempo de conversão do primeiro lançamento único TikTok
- onsite_cost_per_unique_first_launch_conversion_time: Custo por tempo de conversão do primeiro lançamento
- onsite_unique_first_launch: Primeiro lançamento único TikTok
- onsite_cost_per_unique_first_launch: Custo por primeiro lançamento único TikTok
- onsite_unique_non_first_launch: Lançamento não-primeiro único TikTok
- onsite_cost_per_unique_non_first_launch: Custo por lançamento não-primeiro único
- onsite_launch_rate: Taxa de lançamento TikTok
- onsite_total_non_first_launch: Total de lançamentos não-primeiro TikTok
- onsite_cost_per_non_first_launch: Custo por lançamento não-primeiro
- onsite_unique_registration: Registro único TikTok
- onsite_cost_per_unique_registration: Custo por registro único TikTok
- onsite_total_registration: Total de registros TikTok
- onsite_cost_per_registration: Custo por registro TikTok
- onsite_unique_ad_impression: Impressão de anúncio única TikTok
- onsite_cost_per_unique_ad_impression: Custo por impressão de anúncio única
- onsite_ad_impression_rate: Taxa de impressão de anúncio TikTok
- onsite_total_ad_impression: Total de impressões de anúncio TikTok
- onsite_cost_per_ad_impression: Custo por impressão de anúncio
- onsite_total_ad_impression_value: Valor total de impressões de anúncio TikTok
- onsite_value_per_ad_impression: Valor por impressão de anúncio
- onsite_ad_impression_ad_revenue_day0: Receita de anúncio dia 0 TikTok
- onsite_ad_impression_ad_revenue_day6: Receita de anúncio dia 6 TikTok
- onsite_ad_impression_ad_revenue_day13: Receita de anúncio dia 13 TikTok
- onsite_ad_impression_ad_revenue_calendar_day0: Receita de anúncio dia calendário 0 TikTok
- onsite_ad_impression_ad_revenue_calendar_day6: Receita de anúncio dia calendário 6 TikTok
- onsite_ad_impression_ad_revenue_calendar_day13: Receita de anúncio dia calendário 13 TikTok
- onsite_ad_impression_ad_revenue_roas_day0: ROAS de receita de anúncio dia 0 TikTok
- onsite_ad_impression_ad_revenue_roas_day6: ROAS de receita de anúncio dia 6 TikTok
- onsite_ad_impression_ad_revenue_roas_day13: ROAS de receita de anúncio dia 13 TikTok
- onsite_ad_impression_ad_revenue_roas_calendar_day0: ROAS de receita de anúncio dia calendário 0
- onsite_ad_impression_ad_revenue_roas_calendar_day6: ROAS de receita de anúncio dia calendário 6
- onsite_ad_impression_ad_revenue_roas_calendar_day13: ROAS de receita de anúncio dia calendário 13
- cost_per_onsite_add_to_wishlist: Custo por adicionar à lista de desejos TikTok
- value_per_onsite_add_to_wishlist: Valor por adicionar à lista de desejos TikTok
- total_onsite_add_to_wishlist_value: Valor total de adições à lista de desejos TikTok
- onsite_add_billing: Adição de cobrança TikTok
- cost_per_onsite_add_billing: Custo por adição de cobrança TikTok
- onsite_add_billing_rate: Taxa de adição de cobrança TikTok
- value_per_onsite_add_billing: Valor por adição de cobrança TikTok
- total_onsite_add_billing_value: Valor total de adições de cobrança TikTok
- cost_per_onsite_form: Custo por formulário TikTok
- value_per_onsite_form: Valor por formulário TikTok
- total_onsite_form_value: Valor total de formulários TikTok
- onsite_download_start: Início de download TikTok
- cost_per_onsite_download_start: Custo por início de download TikTok
- onsite_download_start_rate: Taxa de início de download TikTok
- onsite_destination_visits: Visitas ao destino TikTok
- cost_per_onsite_destination_visit: Custo por visita ao destino TikTok
- onsite_destination_visit_rate: Taxa de visitas ao destino TikTok
- ix_page_view_count: Contagem de visualizações de página IX
- cost_per_ix_page_view_count: Custo por visualização de página IX
- ix_page_view_count_rate: Taxa de visualizações de página IX
- ix_button_click_count: Contagem de cliques em botão IX
- cost_per_ix_button_click_count: Custo por clique em botão IX
- ix_button_click_count_rate: Taxa de cliques em botão IX
- ix_product_click_count: Contagem de cliques em produto IX
- cost_per_ix_product_click_count: Custo por clique em produto IX
- ix_product_click_count_rate: Taxa de cliques em produto IX
- real_time_app_install: Instalação de app em tempo real
- real_time_app_install_cost: Custo de instalação de app em tempo real
- app_install: Instalações de app. Número de instalações de app atribuídas aos anúncios
- cost_per_app_install: Custo por instalação de app
- unique_ad_impression_events: Eventos únicos de impressão de anúncio (app)
- cost_per_unique_ad_impression_event: Custo por evento único de impressão de anúncio
- customized_ad_impression_event_rate: Taxa de eventos de impressão de anúncio personalizados
- ads_impression_events: Eventos de impressão de anúncio (app)
- cost_pre_ad_impression_event: Custo por evento de impressão de anúncio
- value_per_ad_impression_event: Valor por evento de impressão de anúncio
- total_ad_impression_events_value: Valor total de eventos de impressão de anúncio
- total_ad_impression_roas: ROAS de impressão de anúncio
- ad_impression_ad_revenue_roas_day0: ROAS de receita de impressão dia 0
- ad_impression_ad_revenue_roas_day2: ROAS de receita de impressão dia 2
- ad_impression_ad_revenue_roas_day6: ROAS de receita de impressão dia 6
- ad_impression_ad_revenue_day0: Receita de impressão de anúncio dia 0
- ad_impression_ad_revenue_day2: Receita de impressão de anúncio dia 2
- ad_impression_ad_revenue_day6: Receita de impressão de anúncio dia 6
- unique_custom_app_events: Eventos personalizados únicos de app
- cost_per_unique_custom_app_event: Custo por evento personalizado único de app
- custom_app_event_rate: Taxa de eventos personalizados de app
- custom_app_events: Eventos personalizados de app
- cost_per_custom_app_event: Custo por evento personalizado de app
- value_per_custom_app_event: Valor por evento personalizado de app
- custom_app_events_value: Valor de eventos personalizados de app
- total_purchase_roas_day0: ROAS de compra dia 0 (app)
- total_purchase_roas_day2: ROAS de compra dia 2 (app)
- total_purchase_roas_day6: ROAS de compra dia 6 (app)
- total_purchase_value_day0: Valor de compra dia 0 (app)
- total_purchase_value_day2: Valor de compra dia 2 (app)
- total_purchase_value_day6: Valor de compra dia 6 (app)
- cost_per_next_day_open: Custo por abertura no dia seguinte
- next_day_open_rate: Taxa de abertura no dia seguinte
- total_next_day_open: Total de aberturas no dia seguinte
- cost_per_total_next_day_open: Custo por total de aberturas no dia seguinte
- cost_per_add_payment_info: Custo único por adicionar info de pagamento (app)
- add_payment_info_rate: Taxa de adicionar info de pagamento (app)
- total_add_payment_info: Total de adições de info de pagamento (app)
- cost_total_add_payment_info: Custo total de adicionar info de pagamento
- launch_app: Lançamentos de app únicos
- cost_per_launch_app: Custo por lançamento de app único
- launch_app_rate: Taxa de lançamento de app
- total_launch_app: Total de lançamentos de app
- cost_per_total_launch_app: Custo por total de lançamentos de app
- complete_tutorial: Tutoriais completos únicos (app)
- cost_per_complete_tutorial: Custo por tutorial completo único
- complete_tutorial_rate: Taxa de tutoriais completos
- total_complete_tutorial: Total de tutoriais completos
- cost_per_total_complete_tutorial: Custo por total de tutoriais completos
- value_per_total_complete_tutorial: Valor por total de tutoriais completos
- total_complete_tutorial_value: Valor total de tutoriais completos
- create_group: Grupos criados únicos (app)
- cost_per_create_group: Custo por grupo criado único
- create_group_rate: Taxa de criação de grupos
- total_create_group: Total de grupos criados
- cost_per_total_create_group: Custo por total de grupos criados
- value_per_total_create_group: Valor por total de grupos criados
- total_create_group_value: Valor total de grupos criados
- join_group: Entradas em grupo únicas (app)
- cost_per_join_group: Custo por entrada em grupo única
- join_group_rate: Taxa de entrada em grupos
- total_join_group: Total de entradas em grupos
- cost_per_total_join_group: Custo por total de entradas em grupos
- value_per_total_join_group: Valor por total de entradas em grupos
- total_join_group_value: Valor total de entradas em grupos
- create_gamerole: Personagens de jogo criados únicos
- cost_per_create_gamerole: Custo por personagem criado único
- create_gamerole_rate: Taxa de criação de personagens
- total_create_gamerole: Total de personagens criados
- cost_per_total_create_gamerole: Custo por total de personagens criados
- value_per_total_create_gamerole: Valor por total de personagens criados
- total_create_gamerole_value: Valor total de personagens criados
- spend_credits: Gastos de créditos únicos (app)
- cost_per_spend_credits: Custo por gasto de crédito único
- spend_credits_rate: Taxa de gasto de créditos
- total_spend_credits: Total de gastos de créditos
- cost_per_total_spend_credits: Custo por total de gastos de créditos
- value_per_total_spend_credits: Valor por total de gastos de créditos
- total_spend_credits_value: Valor total de gastos de créditos
- achieve_level: Níveis alcançados únicos (app)
- cost_per_achieve_level: Custo por nível alcançado único
- achieve_level_rate: Taxa de níveis alcançados
- total_achieve_level: Total de níveis alcançados
- cost_per_total_achieve_level: Custo por total de níveis alcançados
- value_per_total_achieve_level: Valor por total de níveis alcançados
- total_achieve_level_value: Valor total de níveis alcançados
- unlock_achievement: Conquistas desbloqueadas únicas (app)
- cost_per_unlock_achievement: Custo por conquista desbloqueada única
- unlock_achievement_rate: Taxa de conquistas desbloqueadas
- total_unlock_achievement: Total de conquistas desbloqueadas
- cost_per_total_unlock_achievement: Custo por total de conquistas desbloqueadas
- value_per_total_unlock_achievement: Valor por total de conquistas desbloqueadas
- total_unlock_achievement_value: Valor total de conquistas desbloqueadas
- in_app_ad_click: Cliques em anúncio dentro do app únicos
- cost_per_in_app_ad_click: Custo por clique em anúncio dentro do app único
- in_app_ad_click_rate: Taxa de cliques em anúncio dentro do app
- total_in_app_ad_click: Total de cliques em anúncio dentro do app
- cost_per_total_in_app_ad_click: Custo por total de cliques em anúncio dentro do app
- value_per_total_in_app_ad_click: Valor por total de cliques em anúncio dentro do app
- total_in_app_ad_click_value: Valor total de cliques em anúncio dentro do app
- in_app_ad_impr: Impressões de anúncio dentro do app únicas
- cost_per_in_app_ad_impr: Custo por impressão de anúncio dentro do app única
- in_app_ad_impr_rate: Taxa de impressões de anúncio dentro do app
- total_in_app_ad_impr: Total de impressões de anúncio dentro do app
- cost_per_total_in_app_ad_impr: Custo por total de impressões de anúncio dentro do app
- value_per_total_in_app_ad_impr: Valor por total de impressões de anúncio dentro do app
- total_in_app_ad_impr_value: Valor total de impressões de anúncio dentro do app
- loan_apply: Solicitações de empréstimo únicas (app)
- cost_per_loan_apply: Custo por solicitação de empréstimo única
- loan_apply_rate: Taxa de solicitações de empréstimo
- total_loan_apply: Total de solicitações de empréstimo
- cost_per_total_loan_apply: Custo por total de solicitações de empréstimo
- loan_credit: Créditos de empréstimo únicos (app)
- cost_per_loan_credit: Custo por crédito de empréstimo único
- loan_credit_rate: Taxa de créditos de empréstimo
- total_loan_credit: Total de créditos de empréstimo
- cost_per_total_loan_credit: Custo por total de créditos de empréstimo
- loan_disbursement: Desembolsos de empréstimo únicos (app)
- cost_per_loan_disbursement: Custo por desembolso de empréstimo único
- loan_disbursement_rate: Taxa de desembolsos de empréstimo
- total_loan_disbursement: Total de desembolsos de empréstimo
- cost_per_total_loan_disbursement: Custo por total de desembolsos de empréstimo
- login: Logins únicos (app)
- cost_per_login: Custo por login único
- login_rate: Taxa de logins
- total_login: Total de logins
- cost_per_total_login: Custo por total de logins
- ratings: Avaliações únicas (app)
- cost_per_ratings: Custo por avaliação única
- ratings_rate: Taxa de avaliações
- total_ratings: Total de avaliações
- cost_per_total_ratings: Custo por total de avaliações
- value_per_total_ratings: Valor por total de avaliações
- total_ratings_value: Valor total de avaliações
- search: Pesquisas únicas (app)
- cost_per_search: Custo por pesquisa única
- search_rate: Taxa de pesquisas
- total_search: Total de pesquisas
- cost_per_total_search: Custo por total de pesquisas
- start_trial: Trials iniciados únicos (app)
- cost_per_start_trial: Custo por trial iniciado único
- start_trial_rate: Taxa de trials iniciados
- total_start_trial: Total de trials iniciados
- cost_per_total_start_trial: Custo por total de trials iniciados
- subscribe: Assinaturas únicas (app)
- cost_per_subscribe: Custo por assinatura única
- subscribe_rate: Taxa de assinaturas
- total_subscribe: Total de assinaturas
- cost_per_total_subscribe: Custo por total de assinaturas
- value_per_total_subscribe: Valor por total de assinaturas
- total_subscribe_value: Valor total de assinaturas
- complete_payment_roas: ROAS de pagamento completo (página)
- total_pageview: Total de visualizações de página
- cost_per_pageview: Custo por visualização de página
- pageview_rate: Taxa de visualizações de página
- avg_value_per_pageview: Valor médio por visualização de página
- total_value_per_pageview: Valor total de visualizações de página
- button_click: Cliques em botão (página)
- cost_per_button_click: Custo por clique em botão
- button_click_rate: Taxa de cliques em botão
- value_per_button_click: Valor por clique em botão
- total_button_click_value: Valor total de cliques em botão
- online_consult: Consultas online (página)
- cost_per_online_consult: Custo por consulta online
- online_consult_rate: Taxa de consultas online
- value_per_online_consult: Valor por consulta online
- total_online_consult_value: Valor total de consultas online
- page_content_view_events: Eventos de visualização de conteúdo de página
- cost_per_page_content_view_event: Custo por evento de visualização de conteúdo
- page_content_view_event_rate: Taxa de eventos de visualização de conteúdo
- value_per_page_content_view_event: Valor por evento de visualização de conteúdo
- total_page_view_content_events_value: Valor total de eventos de visualização de conteúdo
- on_web_order: Pedidos no website
- cost_per_on_web_order: Custo por pedido no website
- on_web_order_rate: Taxa de pedidos no website
- value_per_on_web_order: Valor por pedido no website
- total_on_web_order_value: Valor total de pedidos no website
- add_billing: Adições de cobrança (página)
- cost_per_add_billing: Custo por adição de cobrança
- add_billing_rate: Taxa de adições de cobrança
- value_per_add_billing: Valor por adição de cobrança
- total_add_billing_value: Valor total de adições de cobrança
- page_event_search: Pesquisas de página
- cost_per_page_event_search: Custo por pesquisa de página
- page_event_search_rate: Taxa de pesquisas de página
- value_per_page_event_search: Valor por pesquisa de página
- total_page_event_search_value: Valor total de pesquisas de página
- download_start: Downloads iniciados (página)
- cost_per_download_start: Custo por download iniciado
- download_start_rate: Taxa de downloads iniciados
- value_per_download_start: Valor por download iniciado
- total_download_start_value: Valor total de downloads iniciados
- on_web_add_to_wishlist: Adições à lista de desejos (página)
- cost_per_on_web_add_to_wishlist: Custo por adição à lista de desejos (página)
- on_web_add_to_wishlist_per_click: Adições à lista de desejos por clique
- value_per_on_web_add_to_wishlist: Valor por adição à lista de desejos (página)
- total_on_web_add_to_wishlist_value: Valor total de adições à lista de desejos (página)
- on_web_subscribe: Assinaturas no website
- cost_per_on_web_subscribe: Custo por assinatura no website
- on_web_subscribe_per_click: Assinaturas por clique no website
- value_per_on_web_subscribe: Valor por assinatura no website
- total_on_web_subscribe_value: Valor total de assinaturas no website
- custom_page_events: Eventos personalizados de página
- cost_per_custom_page_event: Custo por evento personalizado de página
- custom_page_event_rate: Taxa de eventos personalizados de página
- value_per_custom_page_event: Valor por evento personalizado de página
- custom_page_events_value: Valor de eventos personalizados de página
Metrics for the Placement Breakdown
- ix_page_duration_avg: Average time your Instant Experience was displayed
- ix_page_viewrate_avg: Average percentage of your Instant Experience content that was viewed
- average_video_play_per_user: Average time your video was watched per user, including any time spent rewatching the video
Metrics included if the Period is daily and the report type is not Reservation
- skan_total_sales_lead_value: The value of lead generation events in your mobile app that were recorded as app events and attributed to your ads. The total count is based on when events are returned through the SKAdNetwork API. There may be a delay between the actual time of conversion and when the conversion is reported
- skan_total_sales_lead: The number of leads generated in your mobile app that were recorded as app events and attributed to your ads. The total count is based on when events are returned through the SKAdNetwork API. There may be a delay between the actual time of conversion and when the conversion is reported
- skan_sales_lead: The number of unique leads generated in your mobile app that were recorded as app events and attributed to your ads. The total count is based on when events are returned through the SKAdNetwork API. There may be a delay between the actual time of conversion and when the conversion is reported
Audience metrics
Available in all other cases that do not include Basic Metrics
- spend: Cost. Sum of your total ad spend
- cpc: CPC (destination). Average cost per click to a specified destination
- cpm: CPM. Average amount spent per 1,000 impressions
- impressions: Impressions. Number of times your ads were shown
- gross_impressions: Gross impressions (includes invalid impressions). Number of times an ad was viewed on screen, including invalid impressions
- clicks: Clicks (destination). Number of clicks from your ads to a specified destination
- ctr: CTR (destination). Percentage of impressions that resulted in a click to the destination relative to all impressions
- conversion: Conversions. Number of times your ad resulted in the selected optimization event
- cost_per_conversion: Cost per conversion. Average amount spent per conversion
- conversion_rate: Conversion rate (CVR, clicks). Percentage of results received from all clicks to the destination of your ads. Note: as of the end of October 2023, this metric’s logic will be updated to be based on impressions (same as conversion_rate_v2)
- conversion_rate_v2: Conversion rate (CVR). Percentage of results received from all impressions of your ads
- real_time_conversion: Real-time conversions. Number of times your ad resulted in the selected optimization event
- real_time_cost_per_conversion: Real-time cost per conversion. Average amount spent per conversion
- real_time_conversion_rate: Real-time conversion rate (CVR, clicks). Percentage of conversions received from all clicks to the destination of your ads. Note: as of the end of October 2023, this metric’s logic will be updated to be based on impressions (same as real_time_conversion_rate_v2)
- real_time_conversion_rate_v2: Real-time conversion rate (CVR). Percentage of conversions received from all impressions of your ads
- result: Results. Number of times your ad resulted in the intended outcome based on the campaign goal and optimization target
- cost_per_result: Cost per result. Average cost per result from your ads
- result_rate: Result rate. Percentage of results that occurred in relation to all impressions of your ads
- real_time_result: Real-time results. Number of times your ad resulted in the intended outcome based on the campaign goal and optimization target
- real_time_cost_per_result: Real-time cost per result. Average cost per result from your ads
- real_time_result_rate: Real-time result rate. Percentage of results that occurred in relation to all impressions of your ads
- currency: Currency. The currency code, e.g., USD
- is_aco: Indicates whether the ad is an automated ad or a Smart Creative. Set to true for an automated ad or Smart Creative
Period
The period defines the granularity of the metric_date column. It is useful for better measurement of certain “count distinct” metrics which may differ in a monthly sum (with monthly granularity) versus the sum of all days in the month (with daily granularity). For example, unique_clicks – if the same user clicked on your ad every day of a month, they would be counted once per day with daily granularity (30 clicks), but only once in a monthly granularity. In that case, using the monthly period in the integration would be correct
Available periods are:
- hourly: separates your data by hour. The metric_date field is shown with the day and a new column metric_datehour is created. This limits the possible metrics in the report
- daily: by day. The metric_date field is shown with the day. Available metrics vary depending on the breakdown
- weekly: by week. The metric_date field shows the Monday of the week and results refer to Monday through Sunday. Metrics vary depending on breakdown
- monthly: by month. The metric_date field shows the first day of the month and the data refers to the period between the first and last day of the month. Metrics vary depending on breakdown
- lifetime: all available data, no metric_date field (reduced number of metrics and breakdowns)
Update Window
This parameter indicates how many days before the savepoint the data will continue to be updated. This means that, with an integration that has a 7-day window, each execution will read 7 days of results. This window is useful in cases where “past” data may still change. For example, a conversion by a user who was impacted by an ad but only converted 3 days later – it is recorded as a conversion from 3 days ago, altering the past
Part of this content was generated or translated with the help of artificial intelligence
New Landing Page View fields (added on 2026-02-05):
total_landing_page_view- Total landing page viewscost_per_landing_page_view- Cost per landing page viewlanding_page_view_rate- Landing page view rate
Available for: Advertiser, Campaign, Ad Group and Ad reports.
- Part of this documentation was automatically generated by AI and may contain errors. We recommend verifying critical information
Add TikTok Ads as a Data Source on Kondado
Connect your TikTok Ads account to Kondado to extract campaign, ad group, ad, and advertiser reports for analysis in your BI tools or data warehouse.
Check permissions and requirements
Ensure you have a TikTok user with at least Ad Account Analyst permission before starting. This data source is currently in beta mode on the Kondado platform.
Create the TikTok Ads data source
Log into Kondado, navigate to Create > Data Source > TikTok Ads, then click the "Sign in with TikTok" button to begin authentication. You can also explore the TikTok Ads source page for more details.
Authorize TikTok permissions
On the subsequent pages, accept all permissions that are requested without modifying any of them. This ensures Kondado can access the necessary advertising data for your reports.
Save and configure your data source
After authorization, save the data source. Then configure your pipelines by selecting appropriate Breakdowns, Metrics, Periods, and Update Window settings based on your reporting needs.
Choose your report type and breakdowns
Select from available reports: Campaign Report, Ad Group Report, Ad Report, or Advertiser Report. Apply breakdowns like campaign_id, adgroup_id, gender, age, country_code, or platform to segment your data.
Send data to your destination
Route your TikTok Ads data to supported destinations such as BI tools, data warehouses, or spreadsheets for visualization and analysis.