Here’s a quick overview of the steps:
2. Choose your report: In just a few moments, Kondado will automatically generate everything for you, providing a link to view the report populated with your data.
Report Features
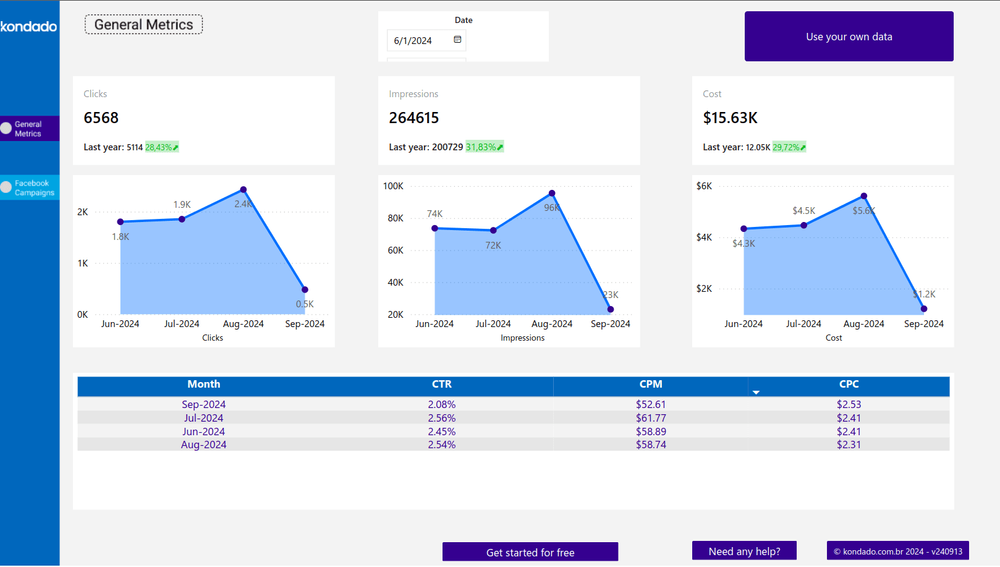
General Indicators Page
Provides an overview of the most important Facebook Ads information, giving you better insight into metrics like clicks, costs, impressions, CTR, and more.
Facebook Ads Campaigns Page
Offers a detailed analysis of key Facebook Ads campaign metrics, organized by day.
Report Metrics
- Clicks: Total number of clicks on your campaigns.
- Impressions: Total number of impressions for your campaigns.
- Cost: Total sum of all campaign costs.
- CTR (Click-Through Rate): The percentage of clicks, calculated by dividing the total number of clicks by the total number of impressions.
- CPM (Cost Per Mille): Cost per thousand impressions, calculated by dividing the total cost by the total number of impressions and multiplying by one thousand.
- CPC (Cost Per Click): Cost per click, calculated by dividing the total cost by the total number of clicks.
- Metric Date: Can be by day, week, month, or year.
![[GIF ENG] FACEBOOK ADS POWER BI.gif](https://kdd-public-files.s3.amazonaws.com/GIF_ENG_FACEBOOK_ADS_POWER_BI_36ac66b9e7.gif)
Improve your campaigns with Kondado
With Kondado, you streamline data analysis and gain strategic insights to boost the performance of your Facebook Ads campaigns. Our report model allows you to track metrics like clicks, impressions, cost, CTR, and much more, all in a personalized and user-friendly way.
Conclusion
Creating a Facebook Ads report in Power BI is an excellent way to monitor the performance of your campaigns in a detailed and strategic manner. With Kondado, you can easily generate and customize your report, accessing essential metrics like clicks, impressions, and costs in just a few minutes.
Create a Facebook Ads report in Power BI with Kondado
Use Kondado's pre-built Facebook Ads model to launch a Power BI report populated with your campaign data, then explore the General Indicators and Campaigns pages.
Sign up or log in to Kondado
Create an account at Kondado or log in if you already use the platform.
Pick the Facebook Ads Power BI report
Choose the Facebook Ads report from the available templates. Kondado configures the source, destination and pipeline automatically and returns a link to your populated dashboard.
Review the General Indicators page
Open the General Indicators page to see total clicks, impressions, cost and CTR for the selected period — useful for a quick performance read.
Analyze the Facebook Ads Campaigns page
Switch to the Campaigns page for day-by-day metrics. Use CPC and CPM alongside CTR to spot under- and over-performing campaigns.
Customize and share the report
Adjust the Metric Date granularity (day, week, month, year), tailor visuals to your taxonomy, and share with stakeholders. See the complete guide for advanced customization.