Steps to Follow:
1. Access Kondado: Create a free account or log in if you are already a user.
2. Choose Your Report: Select the desired report, and within minutes, Kondado will automatically configure everything, providing you with a link to access the complete panel with your data.
Report Features
The report is divided into three main pages:
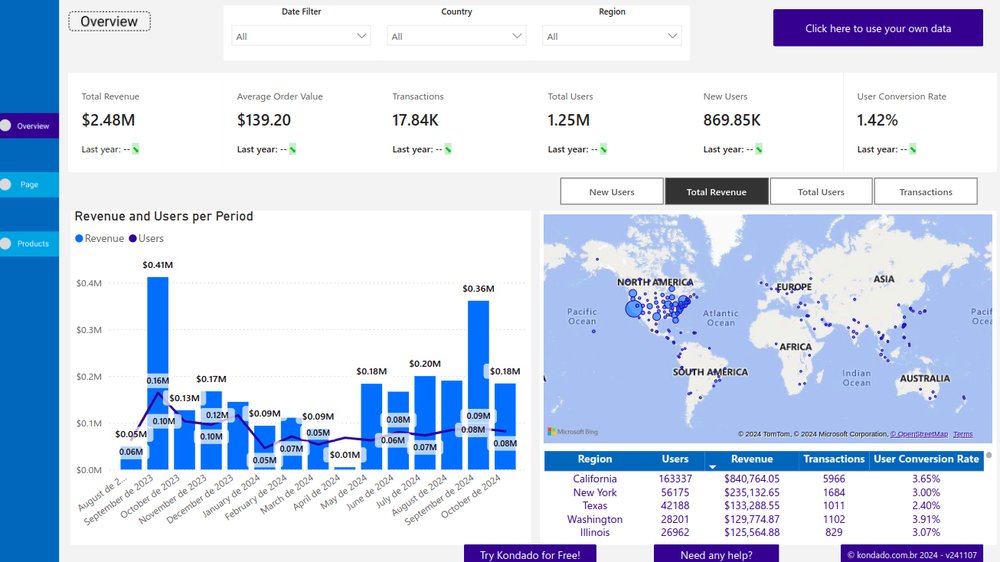
Overview Tab
Shows an overview of the most important business metrics and insights, helping you quickly and clearly understand the company’s key focus areas. You can also apply filters by time period, country, and region, as well as compare data with the previous year.
Pages Tab
Provides a detailed analysis of user interactions on your pages, including data on sessions, source and medium, channel groupings, and campaigns. It also includes a sales funnel view that outlines user behavior from product viewing to purchase.
Products Tab
Presents a complete analysis of product performance, including information on revenue, view counts, and conversion rates. With the product table and ABC curve analysis, it is possible to identify the most profitable items and strategically adjust your portfolio.
Report Metrics
Revenue and Users by Period Chart: A combined bar and line chart with dual axes, allowing for the evaluation of the relationship between revenue and user volume over each period.
Map Chart: Displays the distribution of selected indicators, such as "New Users," "Total Revenue," "Transactions," and "Total Users," by region. Circle sizes vary based on the relative values, making the geographic data easier to analyze.
User Conversion Rate: Shows the percentage of users who triggered a transaction event. It is calculated by dividing "transactions" by "totalusers."
Session Source / Medium Filter: Enables the segmentation of sessions based on Source and Medium, identifying the main traffic sources.
Performance Table: Provides a detailed view of marketing and sales performance, making it simple to analyze the impact of each channel and campaign.
Improve Campaign Management with Kondado
Our platform makes data analysis easier, providing essential insights to help businesses of all sizes improve their strategies.
Conclusion
Using this guide, you can quickly configure a GA4 report in Power BI and explore all its features to gain deep insights into your business performance.
Create a GA4 Report in Power BI with Kondado
Use Kondado's pre-built GA4 dashboard model to launch a Power BI report covering overview, pages and product performance — populated with your own data.
Choose the GA4 report template
Inside the platform, select the GA4 Power BI report. Kondado configures the source, destination and data flow automatically and returns a link to your populated dashboard.
Explore the Overview tab
Use the Overview page to track key metrics with filters by period, country and region, and to compare data with the previous year.
Analyze pages and traffic
On the Pages tab, review sessions, source/medium, channel groupings, campaigns and the funnel from product view to purchase.
Review product performance
On the Products tab, use the product table and ABC curve to identify top revenue items, conversion rates and view counts so you can adjust your portfolio strategy.