In summary, follow these steps:
1- Access Kondado: Create a free account or log in if you’re already a user.
2- Select your preferred report, and within minutes, Kondado will automatically generate everything for you, providing a link to view the complete report with your data.
Report Features
The report is divided into two pages:
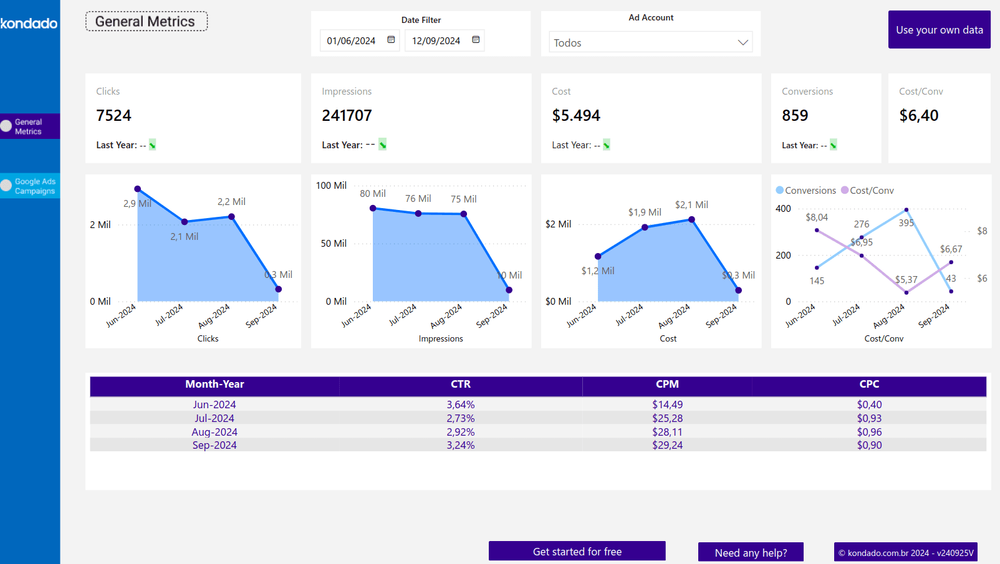
General Indicators Page
Provides an overview of key Google Ads campaign performance metrics such as clicks, cost, impressions, and CTR.
Google Ads Campaigns Page
Contains a detailed summary of metrics related to your campaigns, including filters by ad account, campaign name, and date, along with the metrics mentioned above.
Report Metrics
We’ve selected key metrics in our report to help you monitor and better understand the performance of your Google Ads campaigns. These are essential for analyzing and efficiently adjusting your strategies. Here are some of them:
- Clicks: Total number of clicked interactions in campaigns during the selected period.
- Impressions: The number of times ads were shown in campaigns.
- Cost: Total amount invested in all campaigns within the specified period.
- CTR (Click-Through Rate): The percentage of clicks received in relation to the number of impressions.
- CPM (Cost per Thousand Impressions): The cost calculated for every thousand views of your ads.
- CPC (Cost per Click): The average amount paid for each click, calculated by dividing the total cost by the number of clicks.
![[GIF ENG] FACEBOOK ADS POWER BI.gif](https://kdd-public-files.s3.amazonaws.com/GIF_ENG_FACEBOOK_ADS_POWER_BI_3b5d35211e.gif)
Enhance your campaign management with Kondado
Create a Google Ads Report in Power BI with Kondado
Use Kondado's pre-built Google Ads dashboard model to launch a Power BI report with key campaign metrics — populated automatically with your own data.
Sign up or log in to Kondado
Create a free account at Kondado or log in if you already use the platform.
Select the Google Ads Power BI template
Inside Kondado, choose the Google Ads Power BI report. The platform configures the source, destination and pipeline automatically and returns a link to your dashboard.
Review the General Indicators page
Use the General Indicators page to track total clicks, cost, impressions and CTR for the selected period.
Analyze campaign performance
On the Google Ads Campaigns page, filter by ad account, campaign name and date, and inspect CPC and CPM to spot under- and over-performing campaigns.
Customize and share
Adapt the report to match your taxonomy and share it with stakeholders. See the complete guide for advanced customization.