Understanding your Instagram performance is key to a sharper marketing strategy, but tracking engagement, follower growth, and post impact by hand is overwhelming. Kondado's Instagram report template for Power BI gives you a clear, structured view of the data that matters - and the pipeline keeps it fresh at the frequency you choose. The Instagram Business data source is set up in minutes, and the same data also answers questions in ChatGPT and Claude through Kondado's MCP server (endpoint https://mcp.kondado.io/mcp).
Getting started:
2️. Select the report: Choose your preferred model, and within minutes, Kondado will automatically process your data and generate a link for you to view your fully populated report.
Report Features
Our Instagram report is structured into two main sections:
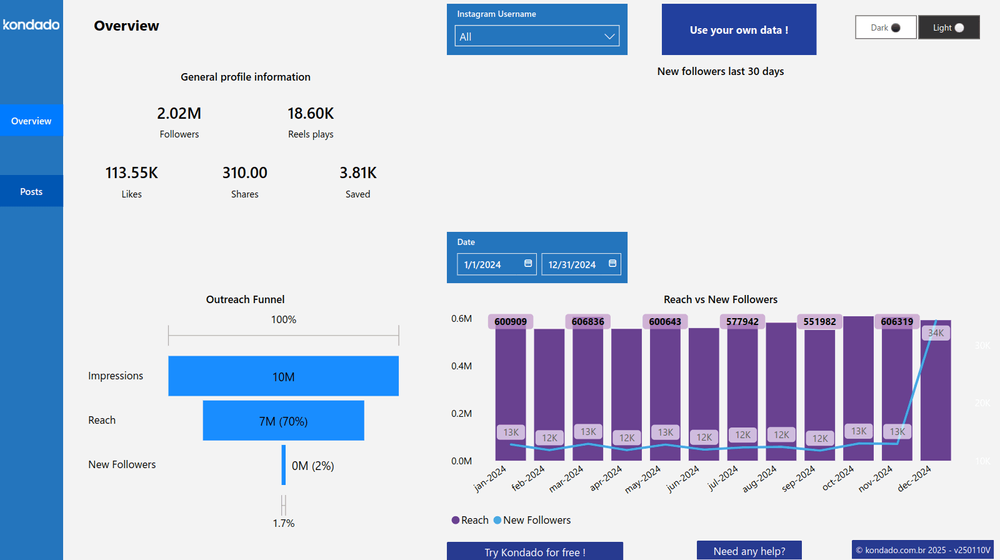
Overview Page
Provides an overview of key Instagram metrics, allowing you to track follower growth over the last 30 days and analyze the audience engagement journey. It serves as a starting point for quickly understanding account performance, highlighting insights such as total followers, reels plays, likes, shares, and saves.
It also delivers monthly insights on reach growth and new followers, making it easier to compare data and identify engagement and growth trends.
Posts Page
Provides a detailed analysis of each post, including engagement metrics such as likes and comments. You can filter by post type (photos, videos, or carousels) and see which hashtags drive the most engagement by content type and period. Note: "photos, videos, or carousels" is the file format (media_type). To separate Reels, Feed, and Stories, the right field is media_product_type - see the box below.
Additionally, you can track performance patterns and trends through a table that displays the featured image, post text, and engagement metrics.
Reels, Feed, and Stories: media_product_type vs media_type
Instagram exposes two similar fields, and confusing them makes the Reels count wrong:
media_product_typetells you where the post lives: AD, FEED, STORY, or REELS.media_typetells you the file format: IMAGE, CAROUSEL_ALBUM, or VIDEO.
To count Reels, use media_product_type = 'REELS'. Filtering by media_type = 'VIDEO' pulls Feed videos into the count and the total won't match. Kondado's .pbix ships with the right field; if you build new visuals, segment format by media_product_type.
Post timestamps are in UTC - convert to your time zone
Each post's timestamp field (in the instagram_media table) is stored in UTC, the Meta API default. To find the best posting hour in your local time zone, apply a time-zone offset when grouping reach by hour of day in Power BI. Skip it and your "best time to post" is off by several hours, which leads to a wrong publishing schedule.
Report Metrics
Outreach Funnel Chart: Displays the volume of Impressions, Reach, and New Followers within the selected period.
Reach x New Followers Chart: Shows the number of people reached by posts each month and the growth of new followers over the defined period.
Hashtag Trends Word Cloud Chart: Highlights the most liked hashtags from your posts, helping you identify trends and the most relevant topics in your profile.
Performance Table: Identify which traffic sources drive the most visits by analyzing session volumes and optimizing your audience acquisition strategies.
Query your Instagram report in natural language with ChatGPT (via MCP)
The same data that powers your Power BI report also answers questions in ChatGPT and Claude. Once Kondado replicates your Instagram Business data into your Via Kondado, Kondado's MCP server (endpoint https://mcp.kondado.io/mcp) lets ChatGPT and Claude query those tables in KSQL and answer in plain English - no CSV export, no screenshots, no spreadsheet. Power BI tracks the recurring KPIs; the chat handles the ad-hoc question.
Example question you can ask right in the chat:
- "Group average reach by day of week and by format (
media_product_type) over the last 90 days - when and in what format should I post?"
Want the full setup walkthrough? See how to analyze Instagram data with ChatGPT.
Track Your Instagram Growth with Kondado
Our platform simplifies data analysis, making it more efficient and accessible while providing strategic insights for businesses of all sizes to enhance their performance.
With our Instagram report in Power BI, you can track follower growth, measure post engagement, analyze hashtag trends, and customize filters to focus on what truly matters for your business—all in a fast and intuitive way!
Create an Instagram Report in Power BI with Kondado
Follow these steps to set up Kondado's pre-built Instagram report in Power BI and start tracking engagement, follower growth, and hashtag performance.
Sign up for a free Kondado account
Create a free account on Kondado or log in with your existing credentials to access the platform's data integration capabilities and reporting features.
Select the Instagram report for Power BI
Choose your preferred Instagram report model from Kondado's available templates. The platform will automatically process your Instagram data and generate a link to your fully populated report.
Explore the Overview page for account metrics
Use the Overview page to track follower growth over the last 30 days, analyze audience engagement, and view key metrics including total followers, reels plays, likes, shares, and saves.
Analyze post-level performance on the Posts page
Filter by post type (photos, videos, or carousels) to identify which content formats and hashtags drive the most engagement, and review the performance table with featured images and post text.
Customize filters and track trends over time
Apply custom filters to focus on specific time periods and content types, then use the Outreach Funnel, Reach charts, and Hashtag Trends Word Cloud to refine your data visualization strategy.