
In the daily routine of efficient management, keeping track of your business numbers quickly is more than an advantage, it's a necessity. With Omie, you already have a robust ERP for financial control, but it’s through well-structured reports that you can truly visualize your company’s financial health, make data-driven decisions, and anticipate risks more confidently.
In this article, you’ll discover the key metrics that should be included in an Omie report and explore different ways to build these analyses.
Key metrics for your Omie report
DRE Table
Shows the evolution of profit, expenses, and investments over time.
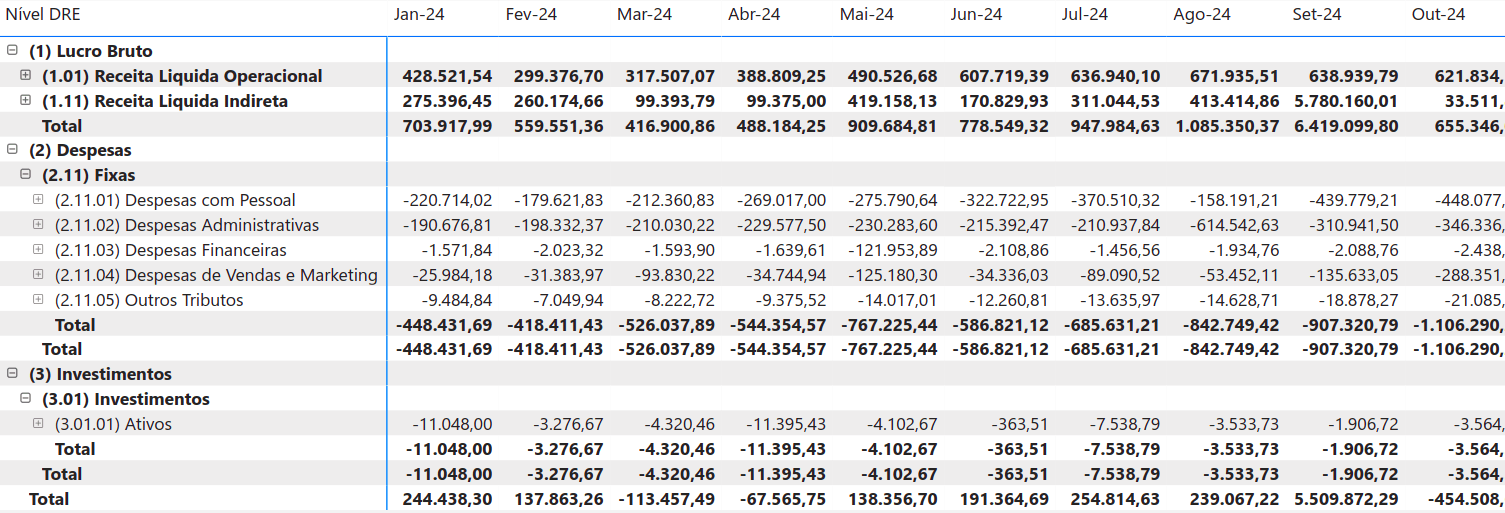
Image of the Omie Power BI Report by Kondado
Delinquency Rate Scorecard
Displays the percentage of overdue invoices compared to the total sales within a given period. For more details, you can click on “View Delinquency Details” in the report and access the chart.
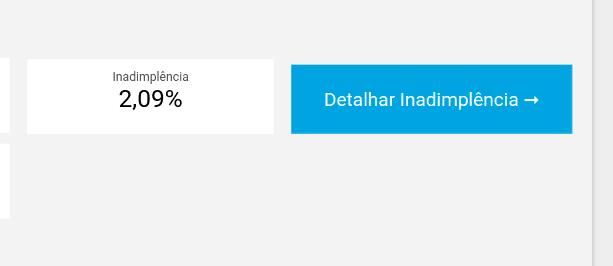
Image of the Omie Looker Studio Report by Kondado
Accounts Receivable by Customer Chart
Identifies customers with the highest outstanding amounts, making financial planning easier.
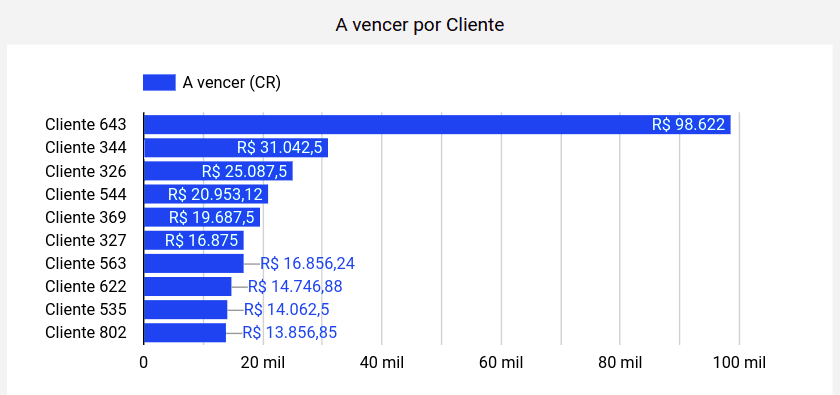
Image of the Omie Power BI Report by Kondado
Issued Invoices Scorecard
Indicates the total value of invoices issued in accounts receivable, providing a clear view of revenue.
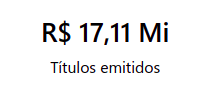
Image of the Omie Power BI Report by Kondado
Due Invoices by Time Range Chart
Indicates the distribution of invoices to be received and paid over time.
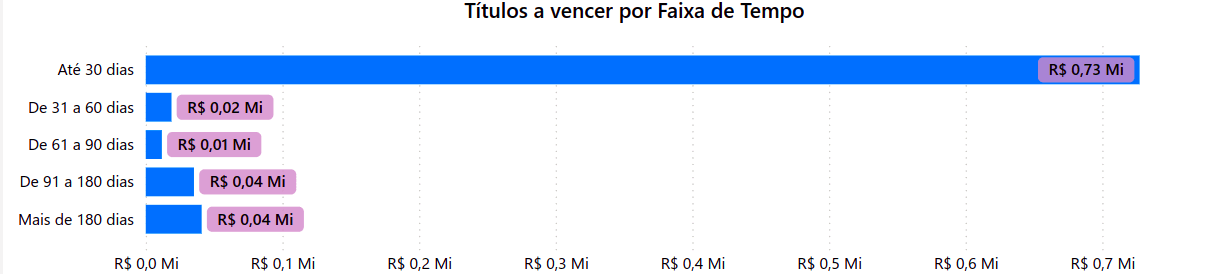
Image of the Omie Looker Studio Report by Kondado
Next 45 Days Chart
Provides a financial estimate that compares the amounts of accounts payable and receivable over the next 45 days.
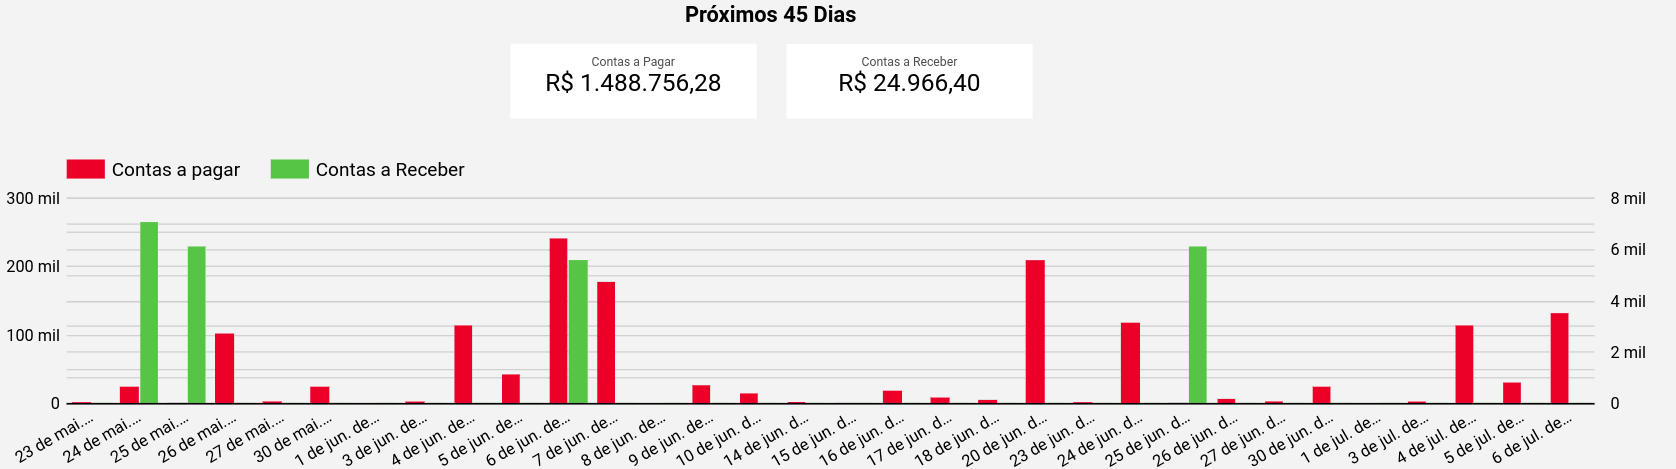
Image of the Omie Looker Studio Report by Kondado
Ways to create your Omie report
There are different ways to build reports using Omie data:
1. Manually:
Exporting data directly from the Omie ERP and organizing it in spreadsheets, creating your own charts and formulas.
2. With Kondado:
- Spreadsheets like Google Sheets and Excel
- BI platforms like Power BI and Looker Studio
- Databases like S3 and PostgreSQL
3. With Kondado’s ready-made templates
Aiming to provide speed and convenience, Kondado offers pre-structured report templates with the main analyses already configured. Just integrate your data and, in moments, you’ll have access to a complete visual report, no need to build anything from scratch.


Make your Omie reports even more efficient with Kondado
Forget manual updates and create personalized, interactive reports, and keep them updated with just a few clicks.
Build an Omie Financial Report
Pick the right Omie metrics and assemble them in a BI tool or spreadsheet, with Kondado loading the data automatically.
Define the metrics that drive financial decisions
List your core Omie metrics: DRE table, delinquency rate, accounts receivable by customer, issued invoices, due invoices by time range, and a 45-day cash projection.
Choose how to source the data
Decide between manual exports from Omie or automated pipelines via Kondado, which loads Omie data into spreadsheets, BI tools, or databases at the frequency you choose.
Pick the right destination
Send the data to Google Sheets or Excel for spreadsheet reporting, to Power BI or Looker Studio for dashboards, or to PostgreSQL or S3 for storage and modelling.
Assemble the visuals
Build the DRE table, delinquency scorecard, accounts receivable chart by customer, issued invoices scorecard, and the time-range and 45-day projection charts. Add filters by date, customer, and category.
Use a ready-made template to skip setup
Start from one of Kondado's Omie report templates for Power BI or Looker Studio and connect your Omie account.