Keeping a constant track of negotiations and interactions with clients is crucial for a successful commercial operation. To get the most out of this tool, creating structured reports is essential to identify opportunities, optimize processes, and increase the conversion rate.
In this article, we will explore the essential metrics for an RD Station CRM report and the most efficient ways to create these reports.
Essential metrics for a complete report
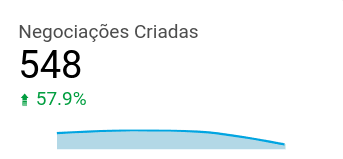
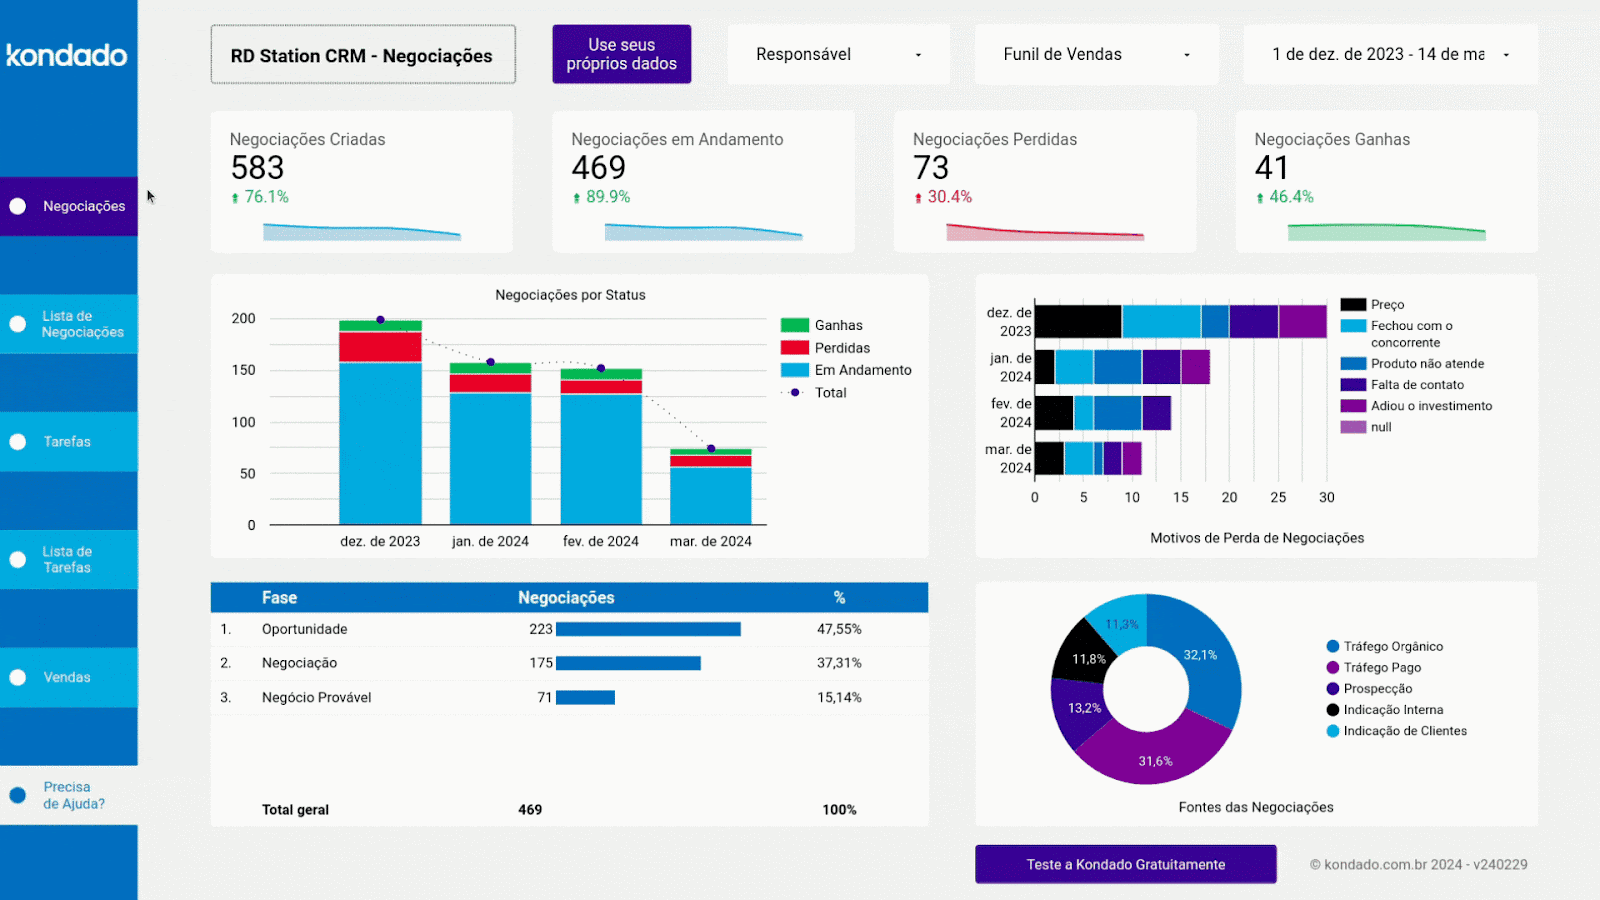
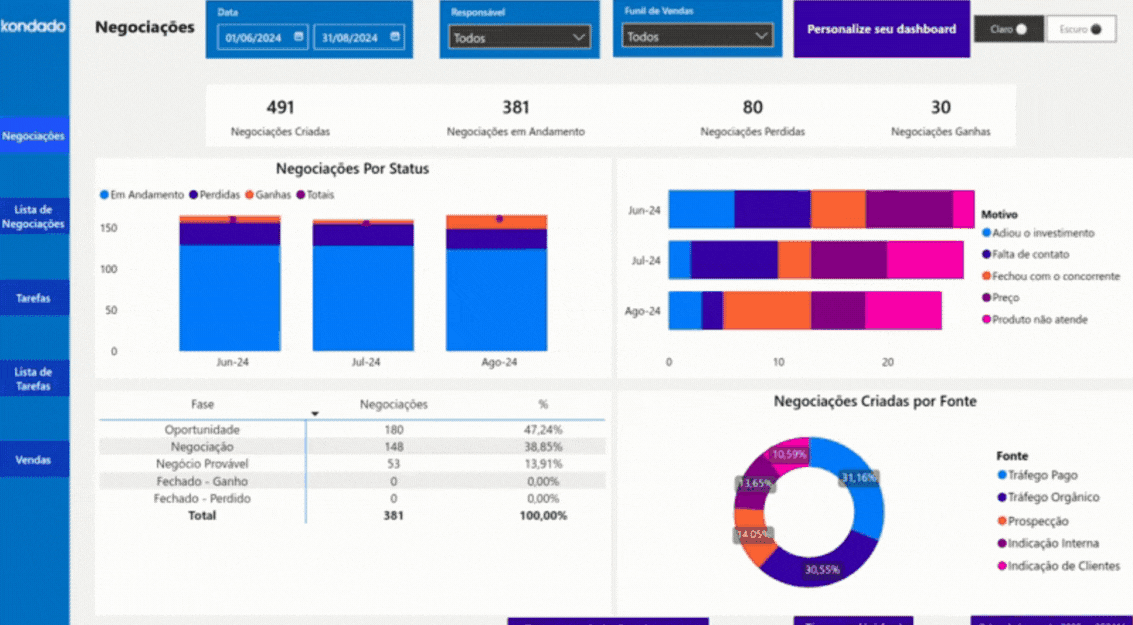
1. Overview of Created Deals
Displays the number of deals created within a specific period, making it easier to track the generation of business opportunities.
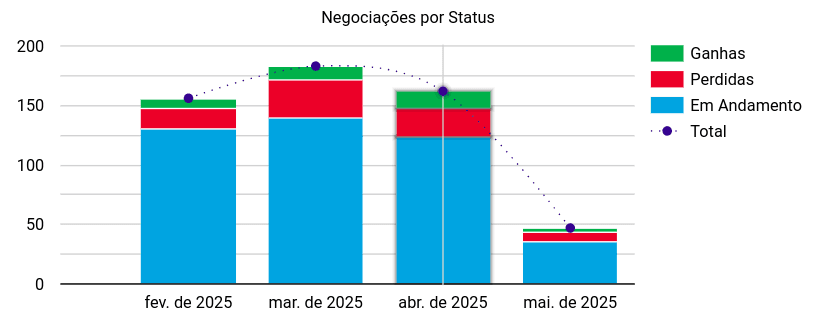
2. Deals by Status Chart
Allows you to visualize the stage of each deal (in progress, won, and lost), helping to understand the sales funnel flow. The dotted line on the chart represents the total count of deals created during the period indicated on the X-axis, highlighting the variation over time.
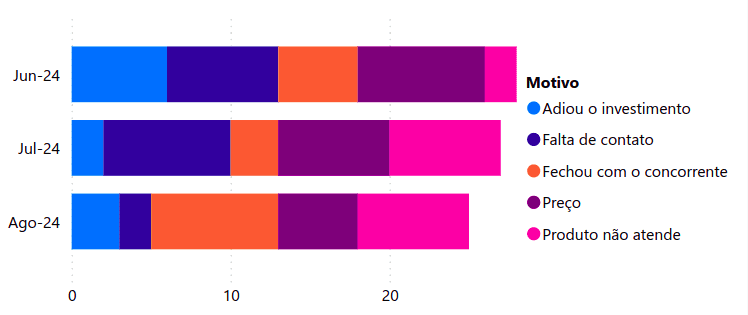
3. Reasons for Lost Deals Chart
This chart shows the main reasons why deals were not completed, allowing you to adjust strategies to minimize future losses.
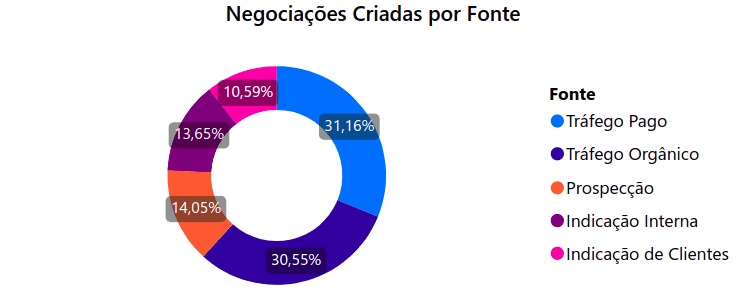
4. Deal Sources Chart
Displays the total number of deals within the defined period and their main sources (organic traffic, paid traffic, prospecting, among others), helping to analyze the effectiveness of prospecting channels.
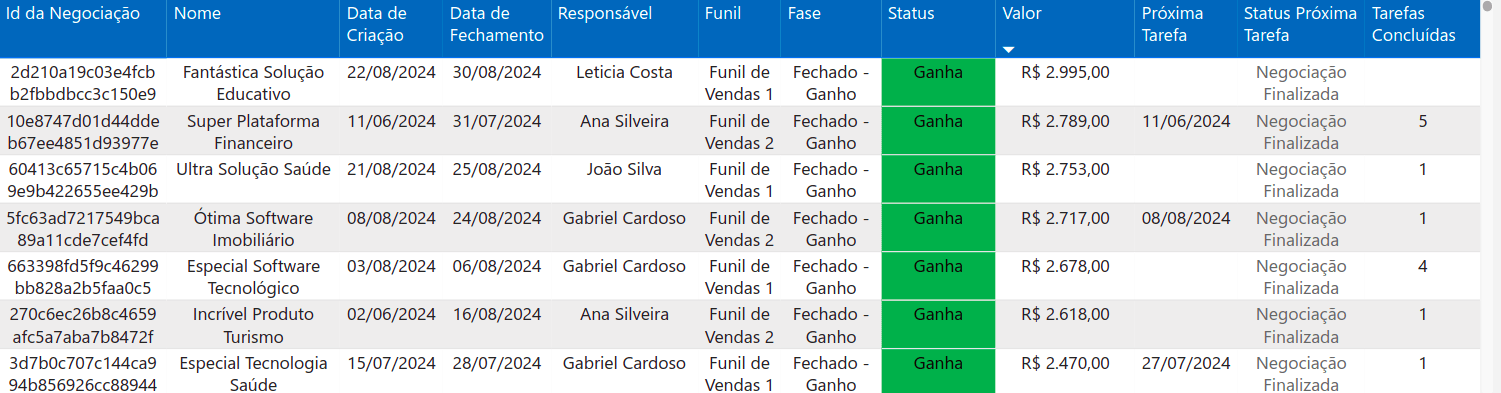
5. Deal List Table
Provides a detailed view of the deals, including information such as name, creation date, responsible person, value, and status.
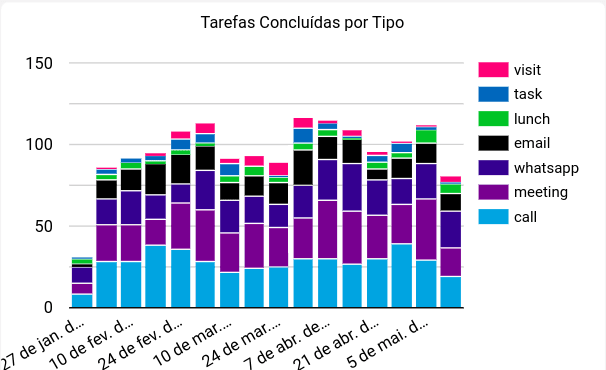
6. Tasks Completed by Type Chart
Lists the number of completed tasks, segmented by type (calls, meetings, emails, etc.).
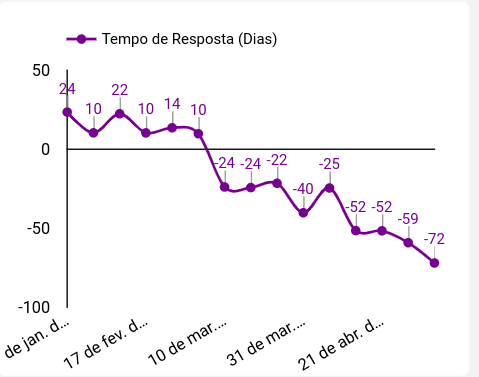
7. Average Response Time (Days) Chart
Represents the average time between the creation of deals and the completion of the first associated task. For ongoing deals that do not yet have associated tasks, the time is calculated between the current date and the deal's creation date.
In the case of closed deals (won or lost) without registered tasks, the calculation considers the number of days between the deal's closure and its creation.
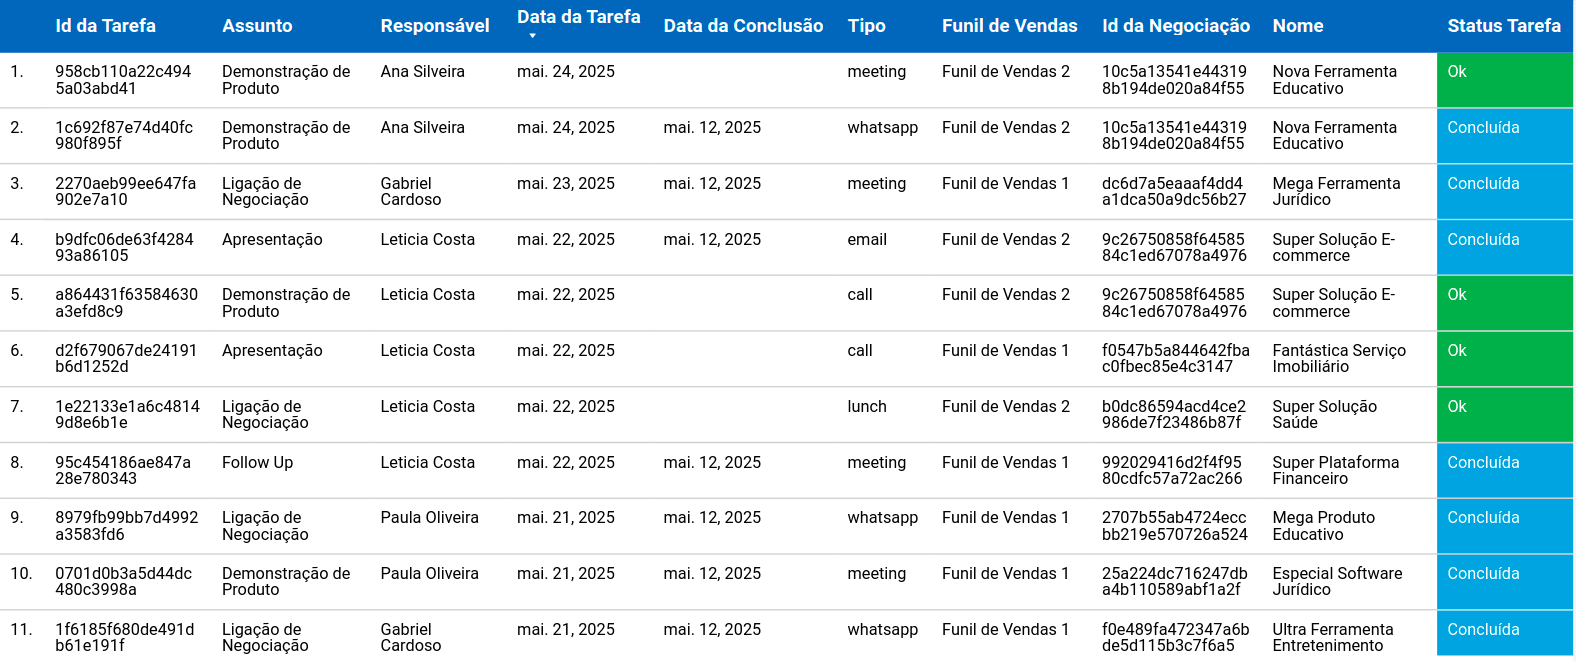
8. Task List Table
Details all tasks linked to the deals, including information such as sales funnel, status, and responsible person, making it easier to track pending and completed activities.
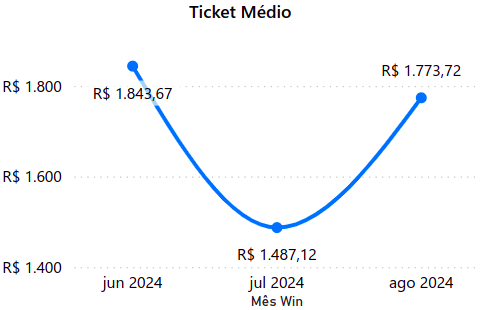
9. Average Ticket
Calculates the average value per sale by dividing the total sales value by the number of sales.
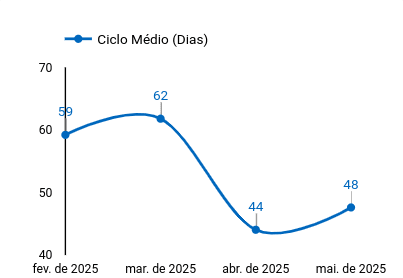
10. Average Cycle (Days) Chart
Measures the average time required for a deal to be completed, helping to identify bottlenecks in the sales process.
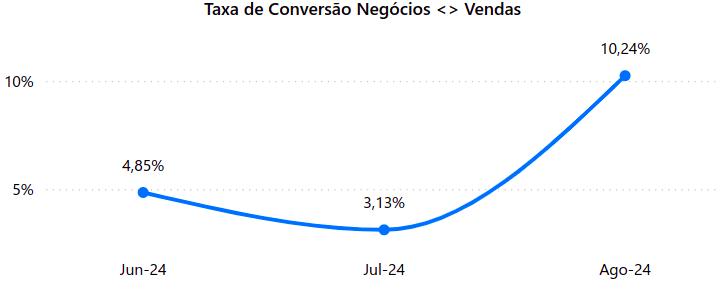
11. Deal to Sale Conversion Rate
The percentage of deals initiated during a given period that turned into completed sales.
Ways to Create an RD Station CRM Report
The available methods to create and visualize RD Station CRM reports are:
- Manual: Data can be manually extracted and structured in spreadsheets for analysis. This option allows for customization but requires more time and effort for constant updates.
- With Kondado: Kondado's integration with RD Station CRM allows you to create custom reports with interactive charts without the need for coding. It also enables you to automate your reports in spreadsheet tools like Google Sheets and Excel, BI platforms like Power BI and Looker Studio, and databases such as Microsoft SQL Server and Redshift.
- Kondado's ready-made templates: Our templates simplify your analysis and allow you to visualize all essential metrics clearly and organized in just a few minutes.
Automate your reports with Kondado
Our pipeline with RD Station CRM enables you to create complete and up-to-date reports across multiple tools without complications.Visualize your deals, track statuses, and make faster, more strategic decisions.
Build an RD Station CRM Report with Key Metrics
Follow these steps to create a complete RD Station CRM report that tracks deals, tasks, and conversion performance using Kondado's automation.
Define your core metrics
Start by selecting the essential metrics for your RD Station CRM report, such as created deals, deal status, lost deal reasons, sources, average ticket, average cycle, and conversion rate. These indicators reveal pipeline health and sales efficiency.
Choose your reporting method
Decide between manual spreadsheet extraction or automated integration. For faster, error-free updates, use Kondado's data integration to connect RD Station CRM directly to your preferred destination.
Connect RD Station CRM to your destination
With Kondado, link RD Station CRM to BI tools like Power BI and Looker Studio, spreadsheets, or databases—no coding required. This automates data flow and eliminates manual refresh work.
Apply a ready-made template or build custom visuals
Leverage Kondado's report templates to visualize all essential metrics in minutes, or create custom interactive charts tailored to your sales process.
Monitor and optimize continuously
Track average response time, task completion by type, and deal-to-sale conversion rate regularly. Use these insights to identify bottlenecks and adjust strategies for higher conversion.