
Most Data Analytics stacks comprise three stages: an ETL tool + a Data Warehouse to centralize data + a visualization or BI tool. Here, we will show you how to use Google Looker Studio as a BI tool, along with BigQuery as your Data Warehouse and Kondado as your ETL tool.
3. Creating your first integration: Now that your data destination and data sources are registered, you can create your first integration by following the platform onboarding steps

Connecting BigQuery as a Data Source:
Click on "Create" in the upper left corner and choose the "Data Source" option:

Select BigQuery from the list:

Click "Authorize" to grant access to BigQuery:

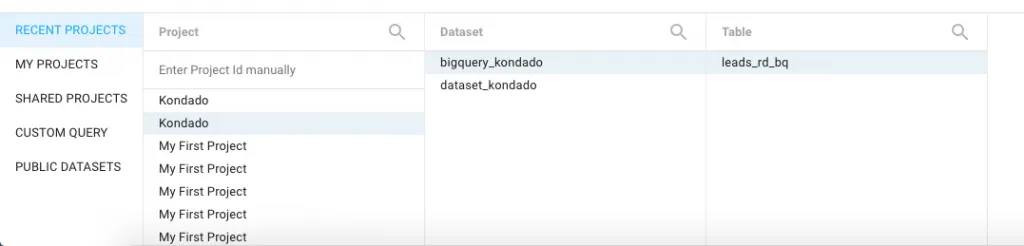
Then, select the Project name, Dataset, and table (which you named when creating the integration in Kondado) that you want to connect to Looker Studio:
Give a name to your Data Source:

Click "Connect" in the upper right corner:

You're all set! Now your table is connected to Looker Studio, where you can create reports, visualizations, or SQL queries.

Integrate Google Looker Studio with BigQuery and Kondado
Set up a complete data analytics stack by connecting your sources through Kondado to BigQuery, then visualizing the data in Google Looker Studio.
Register BigQuery as your destination
Log in to Kondado and register your BigQuery database as a destination to receive centralized data from your tools.
Create your data sources
Identify and register the sources or tools you want to extract data from, following Kondado's step-by-step instructions for each connector.
Build your first integration
With your destination and sources registered, create your first integration using Kondado's platform onboarding steps to start moving data into BigQuery.
Connect BigQuery to Looker Studio
Go to Looker Studio, create a new Data Source, select BigQuery, authorize access, and choose the Project, Dataset, and table that Kondado populated.
Design reports and visualizations
Once connected, use Looker Studio to build reports, dashboards, and SQL queries from your centralized BigQuery data for powerful data visualization.