📹 Facebook Ads Looker Studio
Watch the video below to learn more about this dashboard:
Pipelines and Models
Listed below are the pipelines and models required to use the Report template. Incremental integrations can have the savepoint changed to fetch historical data.
Pipelines:
- Campaign performance (incremental)
Dashboard Features
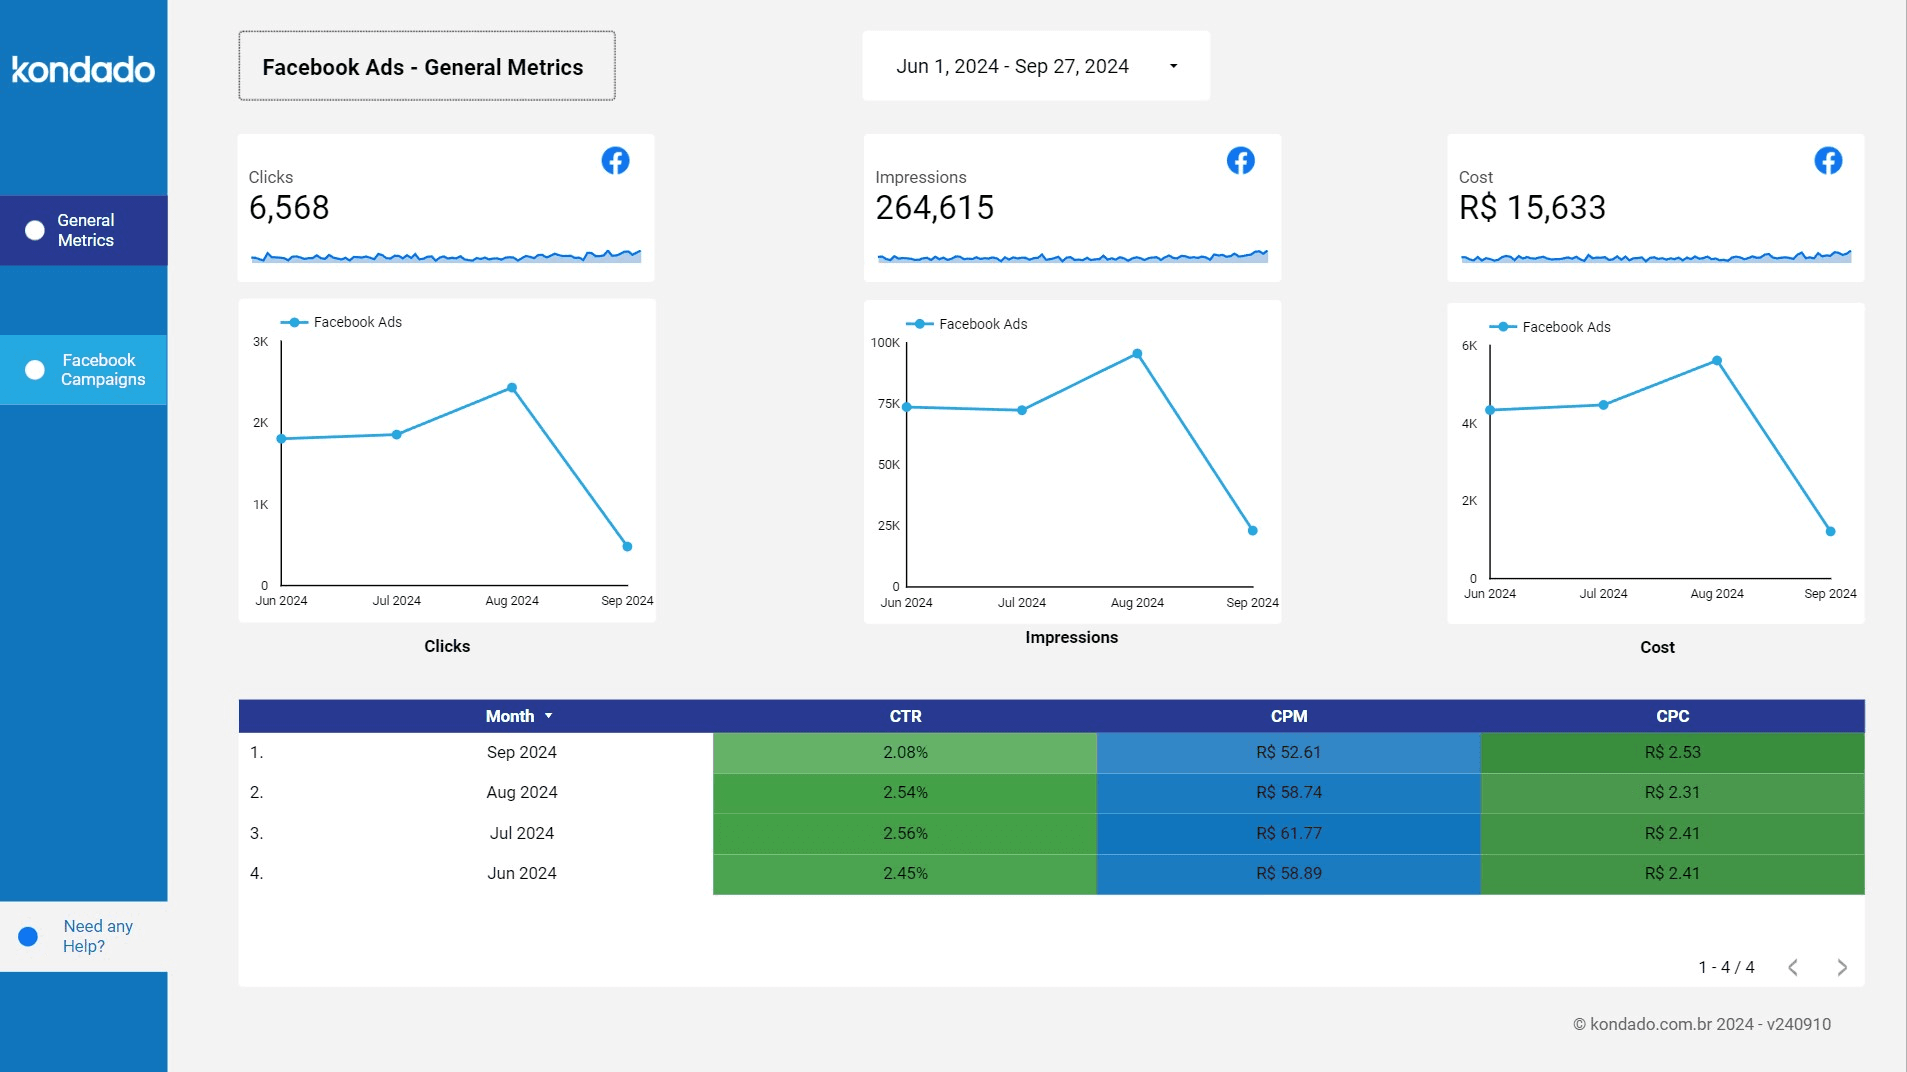
General Metrics Page
This page provides an overview of the key information from Facebook Ads, making it easier to understand metrics such as clicks, cost, impressions, CTR, and others.
Components of the Page
Filters
| Filter | Description | Source Tables | Source Columns |
|---|---|---|---|
| Date | Date selection according to "Date Filter Reference" for each chart | facebook_campaign_insights | According to "Date Filter Reference" for each chart |
Charts
| Chart | Type | Description | Date Filter Reference | Source Tables | Source Columns |
|---|---|---|---|---|---|
| Clicks | Overview with mini-chart | Sum of the number of clicks all campaigns have received during the selected period in the date filter | Metric date | facebook_campaign_insights | facebook_campaign_insights: metric_date, clicks |
| Impressions | Overview with mini-chart | Sum of the number of impressions all campaigns have received during the selected period in the date filter | Metric date | facebook_campaign_insights | facebook_campaign_insights: metric_date, impressions |
| Cost | Overview with mini-chart | Sum of the total cost of all campaigns during the selected period in the date filter | Metric date | facebook_campaign_insights | facebook_campaign_insights: metric_date, spend |
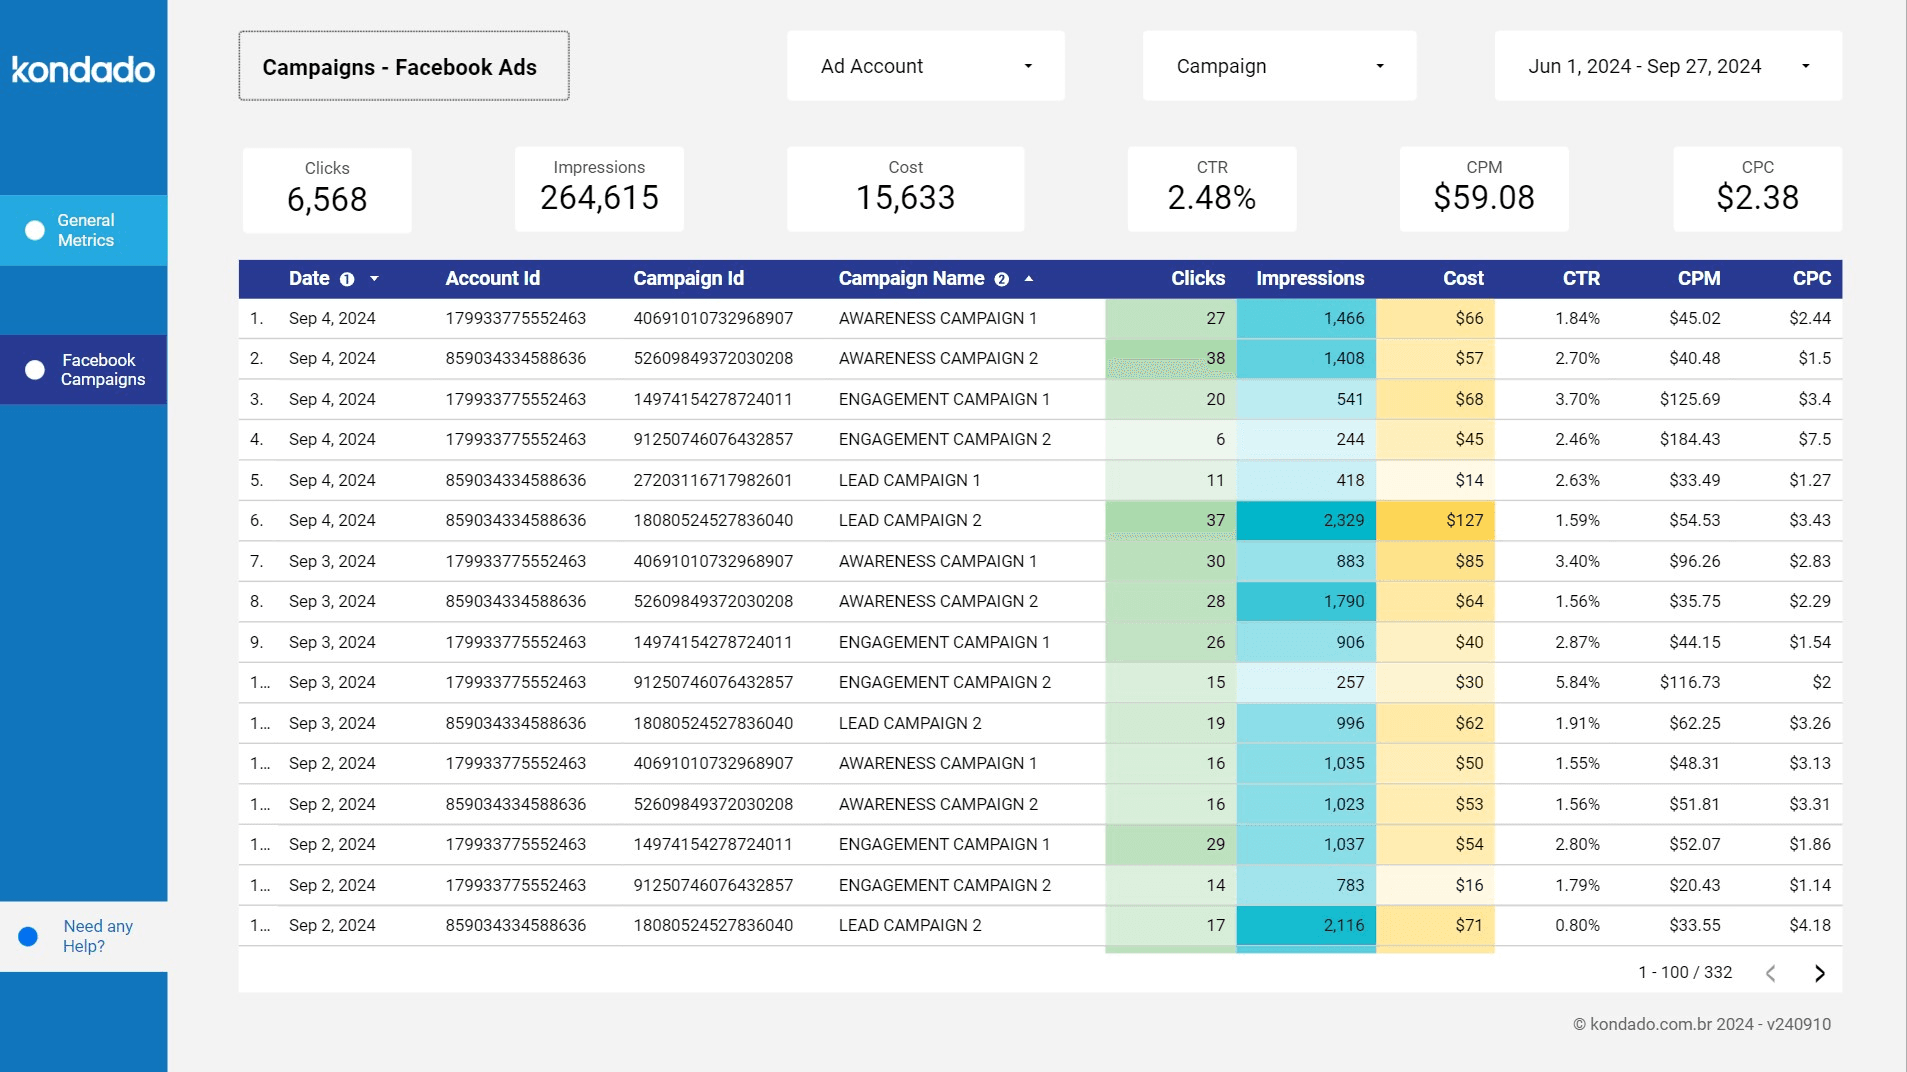
Facebook Campaigns Page
This page provides a detailed view of the key metrics related to Facebook Ads campaigns, broken down by day.
Components of the Page
Filters
| Filter | Description | Source Tables | Source Columns |
|---|---|---|---|
| Ad Account | Selection of ad account ID | facebook_campaign_insights | account_id |
| Campaign | Selection of campaign name | facebook_campaign_insights | campaign_name |
| Date | Date selection according to "Date Filter Reference" for each chart | facebook_campaign_insights | According to "Date Filter Reference" for each chart |
Charts
| Chart | Type | Description | Date Filter Reference | Source Tables | Source Columns |
|---|---|---|---|---|---|
| Clicks | Overview | Sum of the number of clicks all campaigns obtained during the selected period in the date filter | Metric date | facebook_campaign_insights | metric_date, clicks |
| Impressions | Overview | Sum of the number of impressions all campaigns obtained during the selected period in the date filter | Metric date | facebook_campaign_insights | metric_date, impressions |
| Cost | Overview | Sum of the total cost of all campaigns during the selected period in the date filter | Metric date | facebook_campaign_insights | metric_date, spend |
| CTR (Click-Through Rate) | Overview | Division of the total number of clicks by the total number of impressions, resulting in a percentage for the selected period | Metric date | facebook_campaign_insights | metric_date, impressions, clicks |
| CPM (Cost Per Mille) | Overview | Total cost divided by the total number of impressions divided by a thousand (cost per thousand impressions) for the selected period | Metric date | facebook_campaign_insights | metric_date, impressions, spend |
| CPC (Cost Per Click) | Overview | Total cost divided by the total number of clicks (cost per click) for the selected period | Metric date | facebook_campaign_insights | metric_date, spend, clicks |
| Campaign List | Table | - Date: metric date - Ad Account ID: ID of the ad account to which the campaign belongs - Campaign ID: campaign ID - Campaign Name: campaign name - Clicks: sum of clicks on the date for the specified campaign, according to selected filters - Impressions: sum of impressions on the date for the specified campaign, according to selected filters - Cost: sum of the total cost of the specified campaign on the date, according to selected filters - CTR (Click-Through Rate): division of the total sum of clicks by the total sum of impressions of the specified campaign on the date, according to selected filters - CPM (Cost Per Mille): total cost divided by the total sum of impressions divided by a thousand (cost per thousand impressions) of the specified campaign on the date, according to selected filters - CPC (Cost Per Click): total cost divided by the total sum of clicks (cost per click) of the specified campaign on the date, according to selected filters | Metric Date | facebook_campaign_insights | metric_date spend impressions clicks |
Use the Facebook Ads Report in Looker Studio
Follow these steps to set up and explore the Kondado Facebook Ads Report template in Looker Studio with your own data.
Connect your Facebook Ads data source
Set up a pipeline for Campaign performance (incremental) to sync your Facebook Ads metrics into your data warehouse. You can learn more about data integration options on the platform.
Apply the Looker Studio report template
Access the Facebook Ads Report template and connect it to your own data tables, primarily facebook_campaign_insights, to replace the example dashboard with live metrics.
Explore the General Metrics page
Use the date filter to analyze aggregated clicks, impressions, cost, CTR, and other key performance indicators across all campaigns during your selected period.
Drill down on the Facebook Campaigns page
Filter by ad account, campaign name, and date to examine daily breakdowns of clicks, impressions, spend, CTR, CPM, and CPC for individual campaigns.
Customize and share your dashboard
Leverage Looker Studio's native features to adjust visualizations or share reports with stakeholders. For more visualization resources, see data visualization solutions from Kondado.