📹 Facebook Ads Power BI
Watch the video below to learn more about this dashboard:
Pipelines and Models
Listed below are the pipelines and models required to use the Report template. Incremental integrations can have the savepoint changed to fetch historical data.
Pipelines:
- Campaign performance (incremental)
Dashboard Features
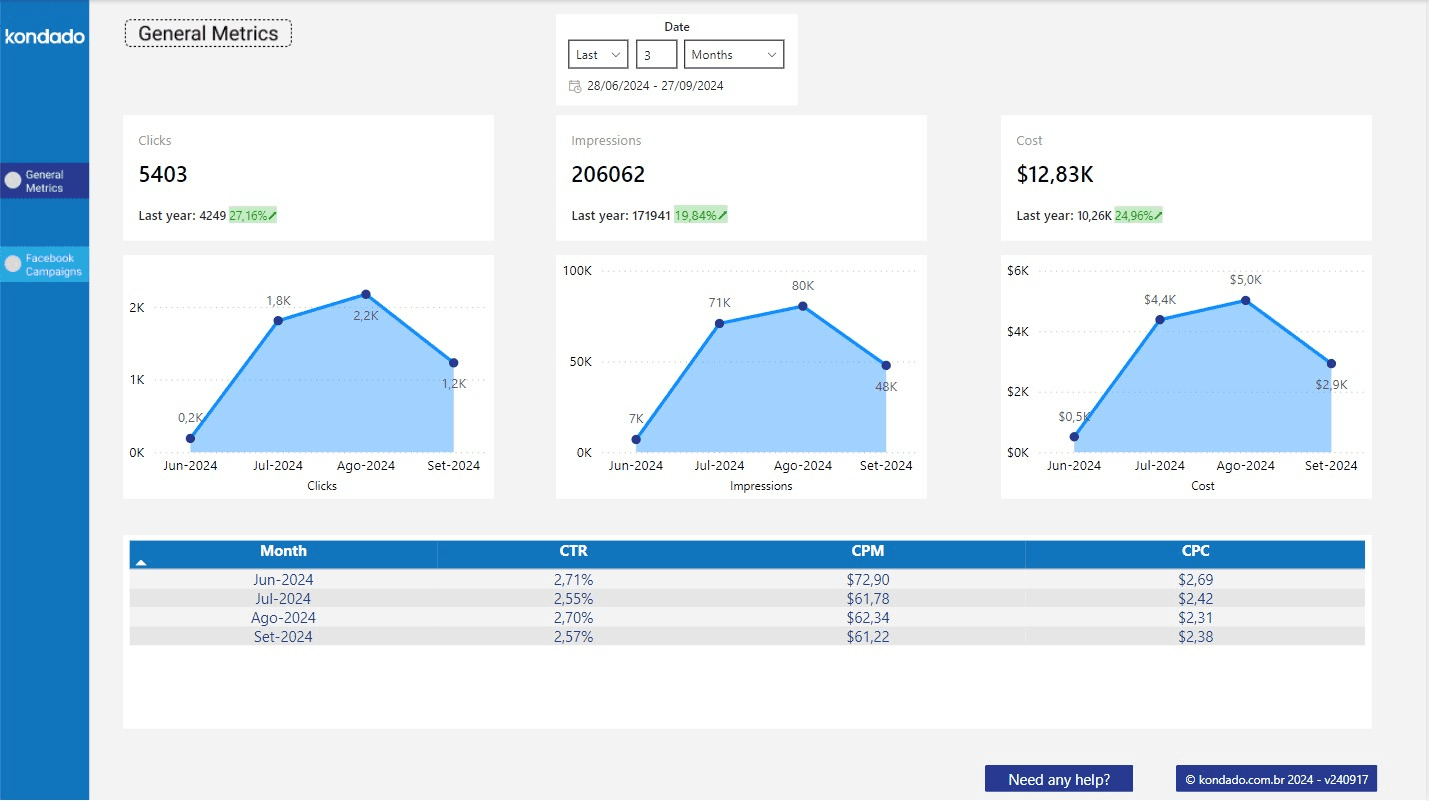
General Metrics Page
This page provides an overview of the key information from Facebook Ads, making it easier to understand metrics such as clicks, cost, impressions, CTR, and others.
Components of the Page
Filters
| Filter | Description | Source Tables | Source Columns |
|---|---|---|---|
| Date | Date selection according to "Date Filter Reference" for each chart | facebook_campaign_insights | According to "Date Filter Reference" for each chart |
Charts
| Chart | Type | Description | Date Filter Reference | Source Tables | Source Columns |
|---|---|---|---|---|---|
| Clicks | Overview with mini-chart | Sum of the number of clicks all campaigns have received during the selected period in the date filter | Metric date | facebook_campaign_insights | facebook_campaign_insights: metric_date, clicks |
| Impressions | Overview with mini-chart | Sum of the number of impressions all campaigns have received during the selected period in the date filter | Metric date | facebook_campaign_insights | facebook_campaign_insights: metric_date, impressions |
| Cost | Overview with mini-chart | Sum of the total cost of all campaigns during the selected period in the date filter | Metric date | facebook_campaign_insights | facebook_campaign_insights: metric_date, spend |
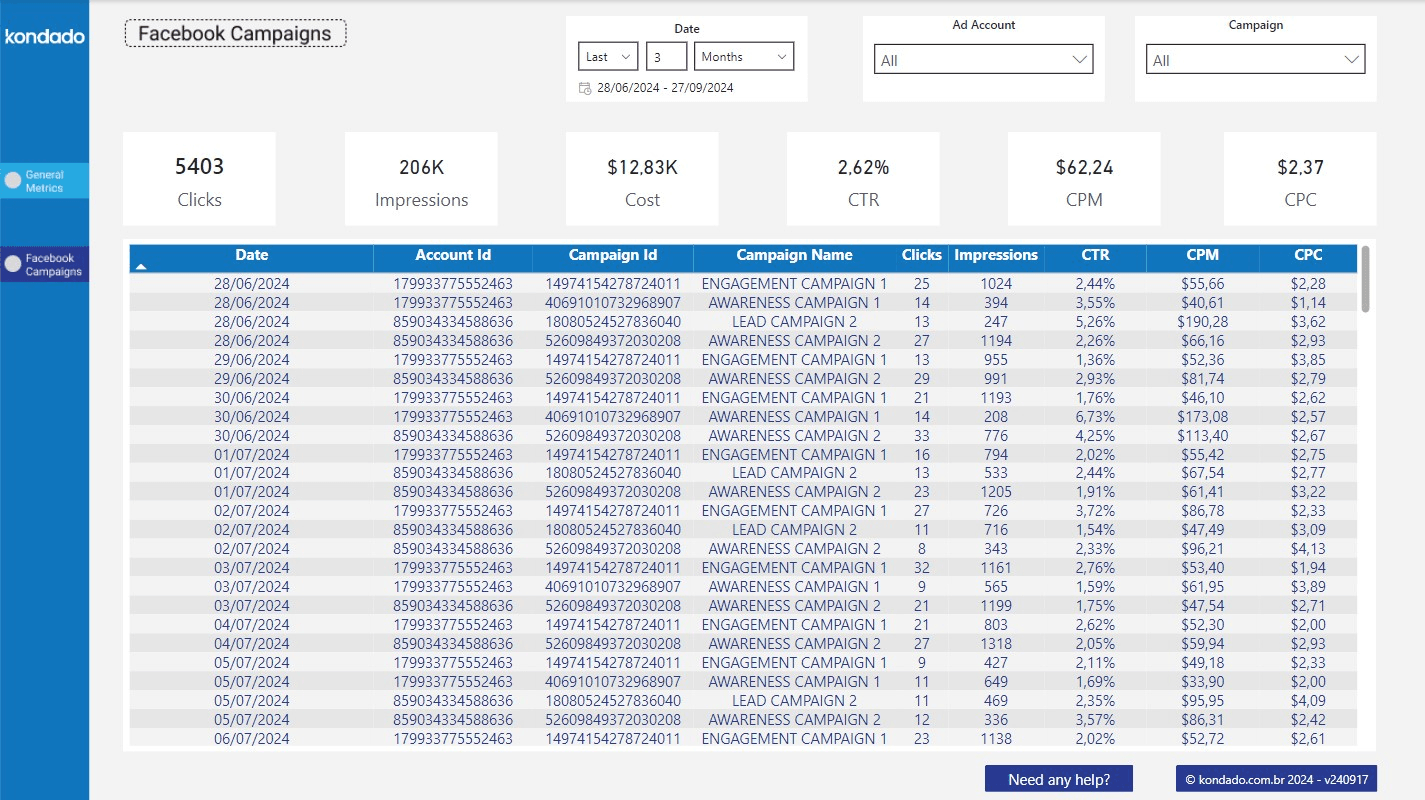
Facebook Campaigns Page
This page provides a detailed view of the key metrics related to Facebook Ads campaigns, broken down by day.
Components of the Page
Filters
| Filter | Description | Source Tables | Source Columns |
|---|---|---|---|
| Ad Account | Selection of ad account ID | facebook_campaign_insights | account_id |
| Campaign | Selection of campaign name | facebook_campaign_insights | campaign_name |
| Date | Date selection according to "Date Filter Reference" for each chart | facebook_campaign_insights | According to "Date Filter Reference" for each chart |
Charts
| Chart | Type | Description | Date Filter Reference | Source Tables | Source Columns |
|---|---|---|---|---|---|
| Clicks | Overview | Sum of the number of clicks all campaigns obtained during the selected period in the date filter | Metric date | facebook_campaign_insights | metric_date, clicks |
| Impressions | Overview | Sum of the number of impressions all campaigns obtained during the selected period in the date filter | Metric date | facebook_campaign_insights | metric_date, impressions |
| Cost | Overview | Sum of the total cost of all campaigns during the selected period in the date filter | Metric date | facebook_campaign_insights | metric_date, spend |
| CTR (Click-Through Rate) | Overview | Division of the total number of clicks by the total number of impressions, resulting in a percentage for the selected period | Metric date | facebook_campaign_insights | metric_date, impressions, clicks |
| CPM (Cost Per Mille) | Overview | Total cost divided by the total number of impressions divided by a thousand (cost per thousand impressions) for the selected period | Metric date | facebook_campaign_insights | metric_date, impressions, spend |
| CPC (Cost Per Click) | Overview | Total cost divided by the total number of clicks (cost per click) for the selected period | Metric date | facebook_campaign_insights | metric_date, spend, clicks |
| Campaign List | Table | - Date: metric date - Ad Account ID: ID of the ad account to which the campaign belongs - Campaign ID: campaign ID - Campaign Name: campaign name - Clicks: sum of clicks on the date for the specified campaign, according to selected filters - Impressions: sum of impressions on the date for the specified campaign, according to selected filters - Cost: sum of the total cost of the specified campaign on the date, according to selected filters - CTR (Click-Through Rate): division of the total sum of clicks by the total sum of impressions of the specified campaign on the date, according to selected filters - CPM (Cost Per Mille): total cost divided by the total sum of impressions divided by a thousand (cost per thousand impressions) of the specified campaign on the date, according to selected filters - CPC (Cost Per Click): total cost divided by the total sum of clicks (cost per click) of the specified campaign on the date, according to selected filters | Metric Date | facebook_campaign_insights | metric_date spend impressions clicks |
Use the Facebook Ads Power BI Report Template
Set up and explore the Kondado Facebook Ads report template in Power BI to analyze campaign performance with pre-built metrics and filters.
Connect your Facebook Ads data source
Set up a pipeline to sync your Facebook Ads campaign performance data. Use an incremental integration to keep metrics current, and adjust the savepoint if you need historical data. Learn more about data integration options.
Load the Power BI report template
Open the Facebook Ads Power BI report template provided by Kondado. Ensure your data model matches the required facebook_campaign_insights table with fields like metric_date, clicks, impressions, and spend.
Explore the General Metrics page
Start with the overview page to see key Facebook Ads KPIs including total clicks, impressions, cost, and CTR. Use the date filter to adjust the reporting period for all charts.
Analyze campaign details by day
Navigate to the Facebook Campaigns page to drill down into daily performance. Apply filters for ad account, campaign name, and date range to isolate specific campaigns.
Review calculated performance metrics
Examine derived metrics like CTR, CPM, and CPC alongside raw data in the campaign list table. These calculations help you understand efficiency and cost trends across campaigns.
Customize or expand your reporting
Consider connecting additional data sources or exploring other visualization options. Browse report templates or learn about data-to-dashboards capabilities for more insights.
Frequently asked questions
facebook_campaign_insights table. This pipeline syncs metrics like clicks, impressions, and spend. You can adjust the savepoint to fetch historical data if needed. Learn more about data integration setup.metric_date column). Each chart sums or calculates data for the selected period, so all visualizations stay synchronized to your chosen date range.