This guide provides a breakdown of the features of Kondado's GA4 Report. If you need help integrating your data into the Report, follow the steps in this guide to set up the integration with GA4 and take advantage of all the features of a customizable Report.
📹 Google Analytics (GA4) Looker Studio
Watch the video below to learn more about this dashboard:
Summary
Pipelines and Models
Listed below are the pipelines and models required to use the Report template. Incremental integrations can have the savepoint changed to fetch historical data.
Pipelines:
- Google Analytics 4 (GA4): Page
- Google Analytics 4 (GA4): Products
- Google Analytics 4 (GA4): Overview
Models:
- ga_page_funnel
- ga_summary_lagging
Dashboard Features
Overview Page
Report tab primarily aimed at providing an overview of key business insights and metrics. It serves as a starting point for a quick and clear understanding of the company's main focal points. Users can apply filters for period, country, and region, and compare with periods from the previous year. Below is a detailed description of each field, along with images and examples.
Filters:
Date Range Filter: This filter allows customization of data visualization based on the selected Month & Year period.
- Type: Period Control
- Data Source: “ga4_summary” table; columns: “yearmonth”
- Note: The available date range for filtering is by months and years.
Country Filter: This filter allows selection of the Country for data display.
- Type: Filter
- Data Source: Table: “ga4_summary”; Column: “country”.
Region Filter: This filter allows selection of the Region (state/province) for data display.
- Type: Filter
- Data Source: Table: “ga4_summary”; Column: “region”.
Charts:
Revenue: The sum of revenue from purchases, subscriptions, and advertising (purchase revenue plus subscription revenue plus ad revenue).
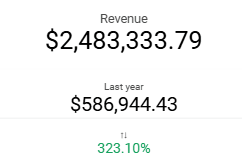
- Type: Overview
- Note: In addition to displaying the total revenue value, there is a comparison (percentage and quantitative) with the same period in the previous year.
- Data Source: Table: “ga4_summary”; Columns: “totalrevenue”.
Average Order Value : Field that displays the average sales value for the selected period.
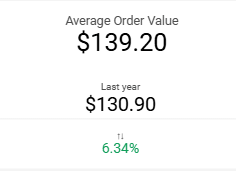
- Type: Overview
- Note: This is the result of dividing "totalrevenue" by "transactions" for the selected period. In addition to displaying the Average Ticket value, there is a comparison (percentage and quantitative) with the same period in the previous year.
- Data Source: Table: “ga4_summary”; Columns: “totalrevenue”, “transactions”.
Transactions: The count of transaction events with purchase revenue. Transaction events include in_app_purchase, ecommerce_purchase, purchase, app_store_subscription_renew, app_store_subscription_convert, and refund.
- Type: Overview
- Note: In addition to displaying the transaction count for the period, there is a comparison (percentage and quantitative) with the same period in the previous year.
- Data Source: Table: “ga4_summary”; Column: “transactions”.
Users: The number of distinct users who registered at least one event, regardless of whether the site or app was in use when the event was recorded.
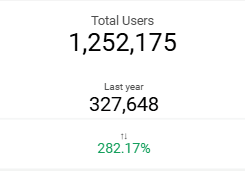
- Type: Overview
- Note: In addition to displaying the number of users for the period, there is a comparison (percentage and quantitative) with the same period in the previous year.
- Data Source: Table: “ga4_summary”; Column: “totalusers”.
New Users: The number of users who interacted with your site or opened your app for the first time (triggered event: first_open or first_visit).
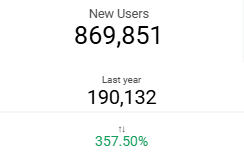
- Type: Overview
- Note: In addition to displaying the number of new users for the period, there is a comparison (percentage and quantitative) with the same period in the previous year.
- Data Source: Table: “ga4_summary”; Column: “newusers”.
User Conversion Rate: The percentage of users who triggered any transaction event.
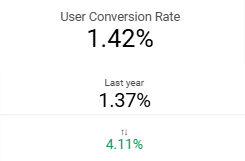
- Type: Overview
- Note: This is calculated as the percentage of "transactions" divided by "totalusers". In addition to displaying the user conversion rate for the period, there is a comparison (percentage and quantitative) with the same period in the previous year.
- Data Source: Table: “ga4_summary”; Columns: “transactions” and “totalusers”.
Revenue and Users by Period Chart: A dual-axis visualization chart that allows analysis of the relationship between revenue and user volume for each period.
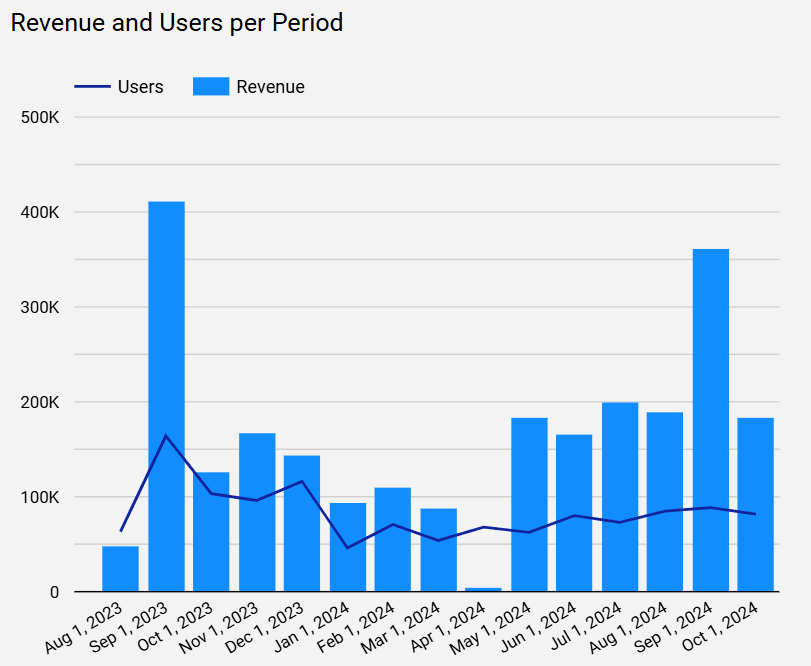
- Type: Bar and Line Chart
- Data Source: Table: “ga4_summary”; Columns: “totalusers”, “totalrevenue”.
Map Chart: A map chart that allows visualization of selected indicators, such as "New Users," "Total Revenue," "Transactions," and "Total Users," by region. The variation in circle sizes on the map reflects the relative values of each parameter, facilitating geographic analysis of the chosen data.
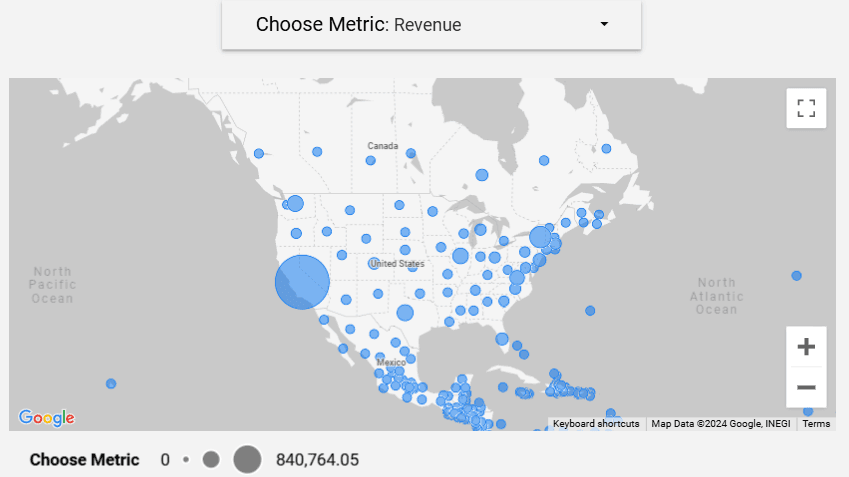
- Type: Map Chart
- Data Source: Table: “ga4_summary”; Columns: “region”, “totalrevenue”, “totalusers”, “newusers”, “transactions”.
Overview Table: A table that provides an overview of the information from the "Summary" tab of the Report.
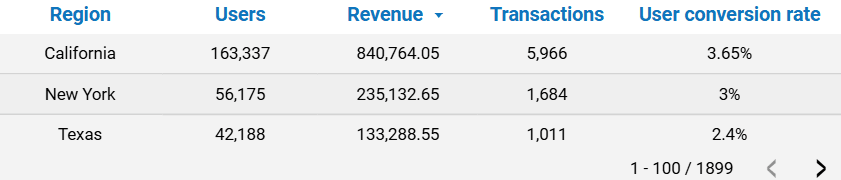
- Type: Table
- Data Source: Table: “ga4_summary”; Columns: “region”, “totalusers”, “totalrevenue”, “transactions”.
Pages Tab
Report tab that offers a detailed analysis of user interactions on your pages, including data on sessions, session source and medium, channel groups, and campaigns. It also includes a sales funnel visualization, revealing user behavior from item views to conversion into sales, providing valuable insights for optimizing engagement strategies.
Filters:
Session Source / Medium Filter: Filters sessions based on Source/Medium, identifying the main traffic sources.
- Type: Filter
- Data Source: Table: “ga4_page”; Column: “sessionsourcemedium”
Default Channel Group Filter: Filters sessions grouped by Default Channel Group to understand the performance of each channel.
- Type: Filter
- Data Source: Table: “ga4_page”; Column: “sessiondefaultchannelgroup”
Charts:
Sales Funnel Chart: Understand your user conversions with the Sales Funnel Chart. View each stage of the journey: Total Users, Items Viewed, Items Added to Cart, and Transactions, with absolute numbers and percentages of the total.
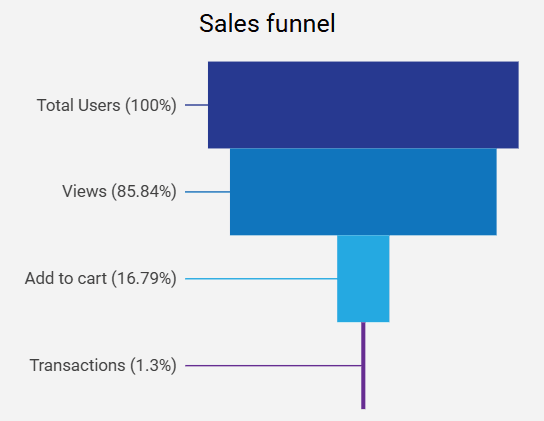
- Type: Funnel Chart
- Data Source: Table: “ga4_page”; Columns: “totalusers”, “itemviewevents”, “addtocarts”, “transactions”.
Sessions by Source/Medium Chart: Understand which traffic sources drive the most visits by viewing session counts, and optimize your acquisition strategies accordingly.
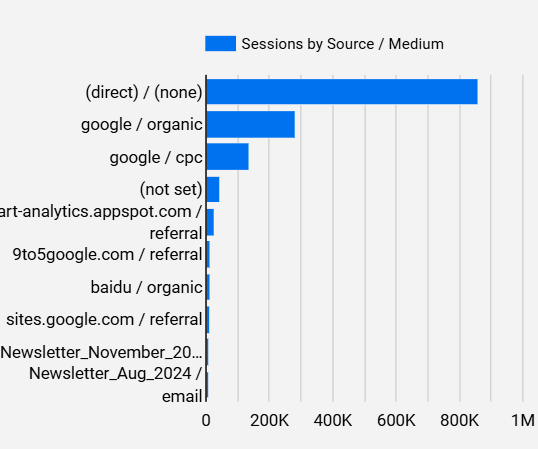
- Type: Horizontal Bar Chart
- Data Source: Table: “ga4_page”; Columns: “sessionsourcemedium”, “sessions”.
Sessions by Default Channel Group Chart: Analyze sessions by Channel Group. Discover which channels bring in the most visits and adjust your marketing strategies to maximize reach. Connect your GA4 data for a clear view of each channel’s performance.
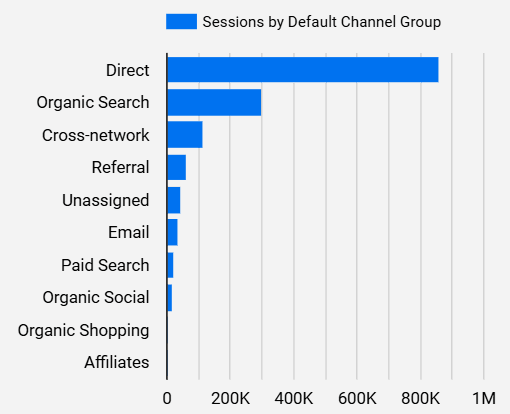
- Type: Horizontal Bar Chart
- Data Source: Table: “ga4_page”; Columns: “sessiondefaultchannelgroup”, “sessions”.
Performance Table: Provides a detailed view of marketing and sales performance. This structure facilitates the analysis of the impact of each channel and campaign, allowing identification of which strategies generate more revenue and engagement, as well as tracking conversion efficiency. This enables optimization of resource allocation and improvement of return on investment in campaigns.
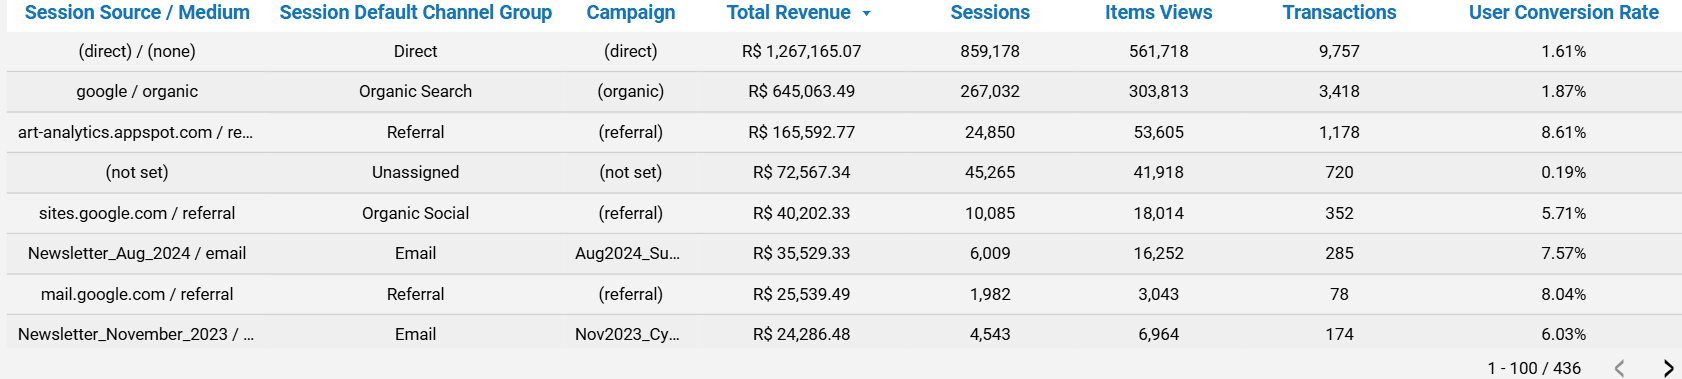
- Type: Table
- Data Source: Table: “ga4_page”; Columns: “sessiondefaultchannelgroup”, “sessioncampaignname”, “totalrevenue”, “sessions”, “itemviewevents”, “transactions”, “totalusers”.
Products Tab
Provides a comprehensive analysis of product performance, displaying data such as revenue, views, and conversion rates. With the product table and ABC curve analysis, identify the most profitable items and optimize your portfolio. This feature enables informed strategic decisions on inventory and marketing, improving product profitability.
Filters:
Item ID Filter: A filter that allows searching by item ID (column: “item_id” from the table: “ga4_produtos”).
Category Filter: A filter that allows searching by item Category (column: “itemcategory” from the table: “ga4_produtos”).
Item Name Filter: A filter that allows searching by Item Name (column: “itemname” from the table: “ga4_produtos”).
Charts :
Products Table: It offers a clear and detailed view of each product’s journey from visibility to purchase. This table enables data-driven insights to refine marketing strategies, improve product positioning, and enhance sales by identifying top-performing items and areas for improvement..
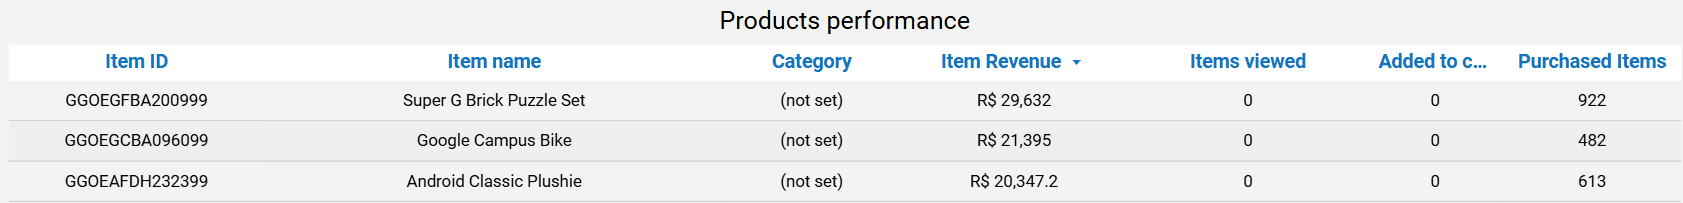
- Type: Table
- Data Source: Table: “ga4_products”; Fields: “itemid”, “itemname”, “itemcategory”, “itemrevenue”, “itemsviewed”, “itemsaddedtocart”, “itemspurchased”.
ABC Curve Table: A table that presents ABC curve information, showing the percentage representation of each item’s sales revenue. Additionally, it displays the corresponding revenue. All information adjusts according to the selected filters.
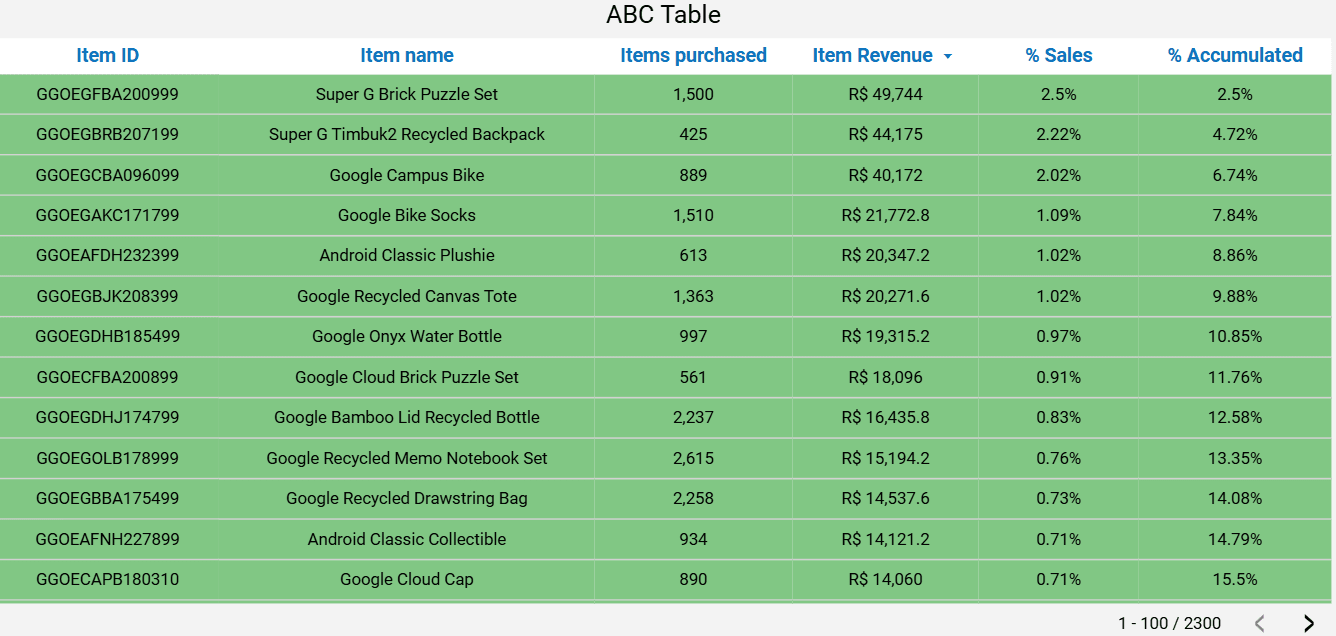
- Type: Table
- Data Source: Table: “ga4_products”; Fields: “itemname”, “itemrevenue”, “items_value”.
Set Up Kondado's GA4 Looker Studio Report
Follow these steps to integrate your Google Analytics 4 data with Kondado's Looker Studio report template and start analyzing your metrics.
Connect GA4 data sources to Kondado
Set up the required pipelines in Kondado to extract your GA4 data: Page, Products, and Overview. You can learn more about data integration options on our platform. Ensure incremental integrations are configured to fetch historical data if needed.
Build the required data models
Create the two essential models that power the report: ga_page_funnel for the Pages tab funnel analysis, and ga_summary_lagging for the Overview tab metrics. These models transform raw GA4 data into analysis-ready tables.
Configure filters for your business needs
Customize the report filters including Date Range (by month/year), Country, and Region filters on the Overview tab, plus Session Source/Medium and Default Channel Group filters on the Pages tab to match your analytical requirements.
Explore the three report tabs
Navigate through the Overview tab for high-level KPIs like Revenue and User Conversion Rate, the Pages tab for funnel and traffic source analysis, and the Products tab for ABC curve and item performance insights. See more data visualization capabilities on our platform.
Apply period-over-period comparisons
Use the built-in year-over-year comparison features across all overview metrics to track performance trends and identify growth opportunities in your GA4 data.