This guide provides a breakdown of the features of Kondado's Organic Instagram Looker Studio Report. If you need help integrating your data into the Report, follow the steps in this guide to set up the integration with Instagram and take advantage of all the features of a customizable Report.
📹 Instagram Looker Studio
Watch the video below to learn more about this dashboard:
Overview Page
This report page is designed to provide an overview of essential metrics for an Instagram profile. It serves as a starting point for quickly understanding the overall account performance and identifying trends in engagement and reach. The scorecards display key information such as the total number of followers, Reels plays, likes, shares, and saves, enabling instant analysis of audience engagement. Users can track follower growth over the past 30 days and view the audience engagement journey through the "Reach Funnel" chart, showing metrics from impressions to new followers based on the selected period. Additionally, monthly insights on reach and new followers are provided, allowing consistent comparisons and the identification of performance patterns. Below, a detailed description of each field is provided, along with images and examples.
Filters:
Instagram Username Filter: This is the filter where you can select which Instagram profile's data you want to view.
- Type: Filter.
- Data Source: Table “instagram_account_daily_insights”; columns: “ig_username”.
Date Filter: This is the filter where you can select the date range for displaying the data.
- Type: Period Control
- Data Source: Table: “instagram_account_daily_insights”; Column: “metric_date”.
- Note: In this visual, only the Reach Funnel chart and the Reach vs. New Followers chart are affected by the date filter.
Charts:
Followers: Total number of followers for the profile.
- Type: Overview
- Data Source: Table: “instagram_profiles”; Columns: “followers_count”
Reels Plays : The number of Reels plays for the profile.
- Type: Overview
- Data Source: Table: “instagram_media_insights”; Column: “reels_plays”.
Likes: Total number of likes on the profile's posts..
- Type: Overview
- Data Source: Table: “instagram_media_insights”; Column: “likes”.
Shares: Total number of shares for the profile's posts..
- Type: Overview
- Data Source: Table: “instagram_media_insights”; Column: “shares”.
Saved: Saved posts for the profile..
- Type: Overview
- Data Source: Table: “instagram_media_insights”; Column: “saved”.
New Followers Last 30 days Chart: Line chart that allows analyzing the daily number of new followers for the profile over the past 30 days based on the data integration..
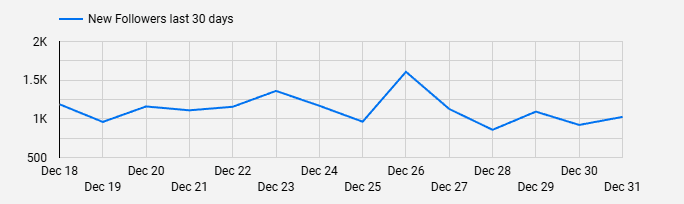
- Type: Line Chart
- Data Source: Table: “instagram_account_daily_insights”; Columns: “metric_date”, “followers_count”.
- Note: Due to limitations of the Instagram API being used, metric data may have a delay of up to 48 hours during retrieval.
Outreach Funnel Chart: Funnel chart displaying the number of Impressions, Reach, and New Followers based on the selected period..
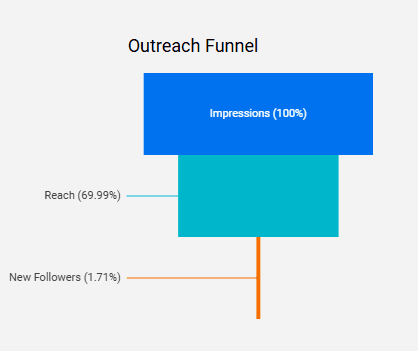
- Type: Funnel Chart
- Data Source: Table: “instagram_account_daily_insights”; Columns: “impressions”, “reach”, “followers_count”.
Reach x New Followers Chart: Bar and line chart that shows the monthly number of people reached by the posts and new followers, based on the selected period.
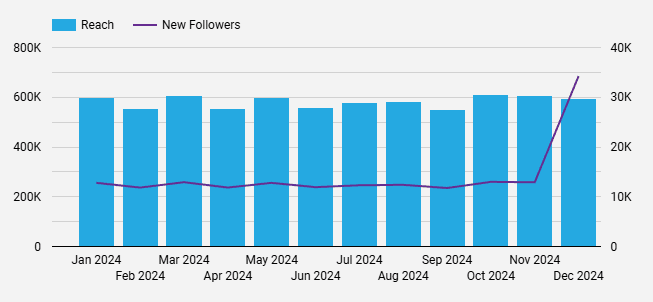
- Type: Bar and Line Chart
- Data Source: Table: “instagram_account_daily_insights”; Columns: “metric_date”, “reach”, “followers_count”.
Posts Page
The Posts report page allows you to explore detailed metrics for your posts, such as likes and comments. With a detailed table that includes the featured image, text, and engagement metrics for each post, you can identify patterns and trends. Use the filters to segment by media type, content, and specific periods. Connect your Instagram data with Kondado and gain valuable insights to enhance your digital strategies.
Filters:
Media product type Filter: Filter that allows viewing data based on content type, such as "Feed," "Reels," or "Story."
- Type: Filter
- Data Source: Table: “instagram_media_insights”; Column: “media_product_type”
Media type Filter: Filter that allows selecting the media type of posts, such as Image, Video, or Carousel.
- Type: Filter
- Data Source: Table: “instagram_media”; Column: “media_type”
Year & Month Filter: Filter that allows selecting the date range of the data in Year/Month format.
- Type: Filter
- Data Source: Table: “instagram_media_with_effective_url”; Column: “timestamp”
Charts:
Performance Table: Understand which traffic sources drive the most visits by visualizing the number of sessions, and optimize your acquisition strategies.
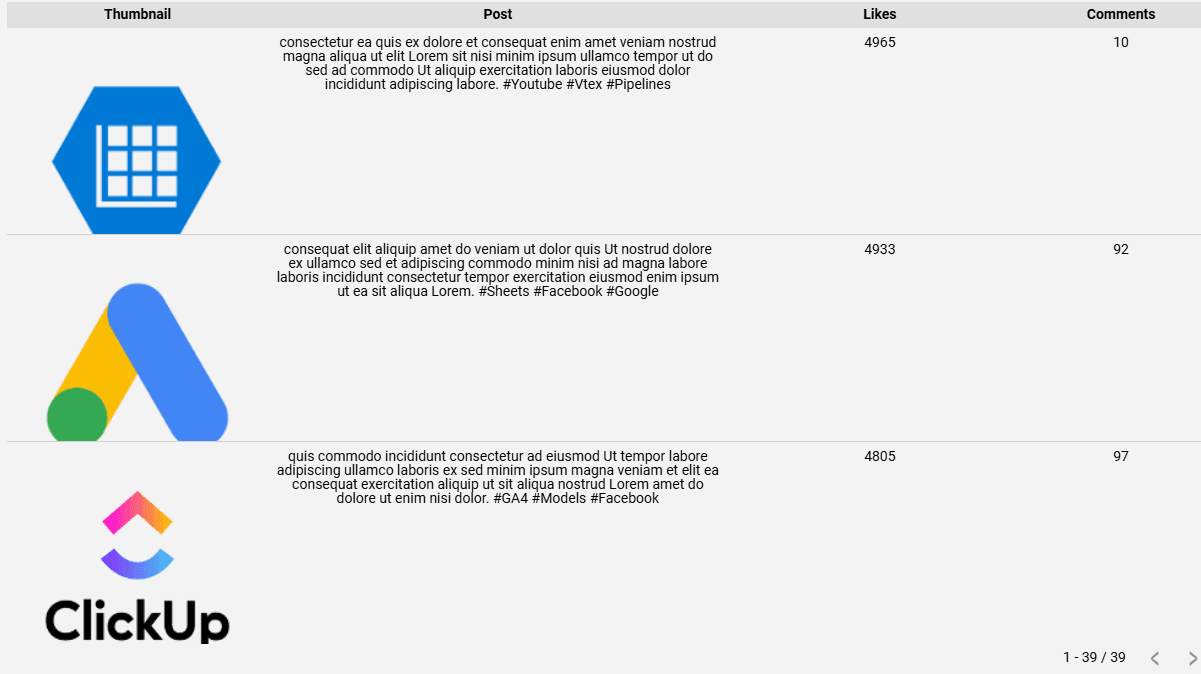
- Type: Table
- Data Source: Table: “instagram_media_with_effective_url”; Columns: “like_count”, “effective_media_url”, “caption”, “comments_count”.
Set Up Kondado's Organic Instagram Looker Studio Report
Follow these steps to integrate your Instagram data with Kondado and start using the customizable Looker Studio report for organic performance analysis.
Connect Instagram as a data source
Set up the Instagram integration in Kondado to start pulling your organic profile data, including followers, Reels plays, likes, shares, and saves into your data warehouse. Learn more about data integration options on the platform.
Configure your data destination
Choose where your Instagram data will be stored so Looker Studio can access it. Kondado supports multiple destinations including data warehouses and BI-ready formats.
Apply filters for profile and date range
In the Overview page, use the Instagram Username Filter to select your profile and the Date Filter to set your analysis period. Note that the Reach Funnel and Reach vs. New Followers charts respond to date changes.
Analyze engagement metrics and trends
Review scorecards for followers, Reels plays, likes, shares, and saves. Use the New Followers Last 30 days chart and Reach Funnel to identify audience growth patterns and engagement trends.
Drill down into post-level performance
Switch to the Posts page to examine individual post metrics. Apply the Media Product Type, Media Type, and Year & Month filters to segment content and optimize your digital strategy based on detailed engagement data.