Currently, there is an inconsistency in Looker Studio that sometimes the count distinct does not work correctly when tied to a date filter. This is a flaw recognized and reported by the community, as can be seen in the following links: Link1; Link 2; Link 3.
A commonly used method by users to fix this problem is to perform a blend of the table being used with itself. If you are experiencing this issue, just follow the step-by-step guide below:
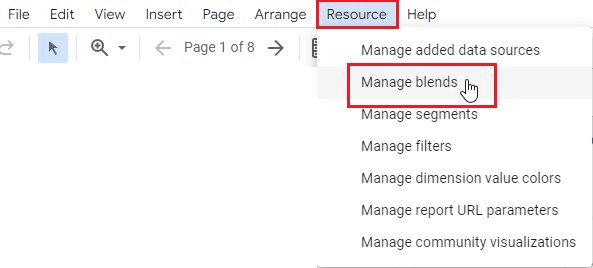
1 - In the Looker Studio taskbar, click on “Resource” and then on “Manage blends”;
2 - Next, click the “Add a Blend” button;

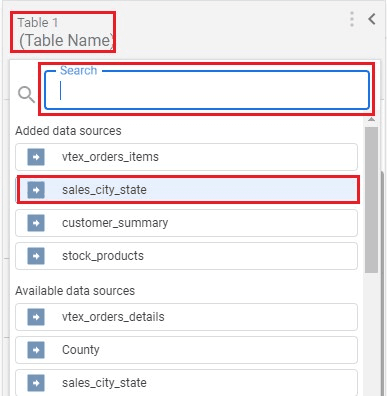
3 - In “Table 1,” search for the table you want to use; in this example, we will use the table “sales_city_state”;
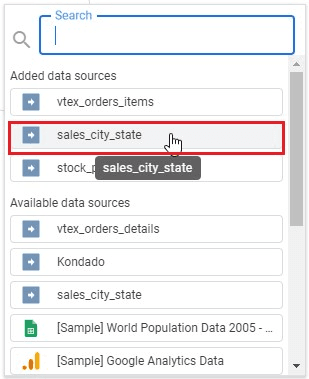
4 - Now click the “Join another table” button and select the same table;

5 - In both tables, under “Dimensions,” first select the key to be used between the tables; in this case, the key is “orderid”;
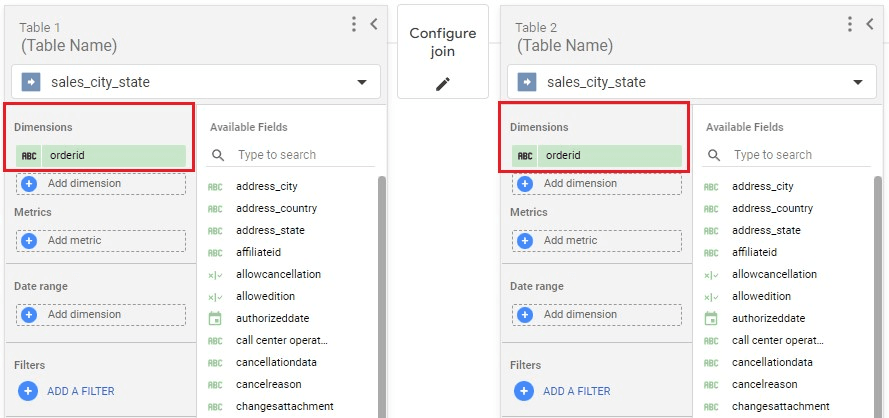
6 - Now click on “Configure Join”;
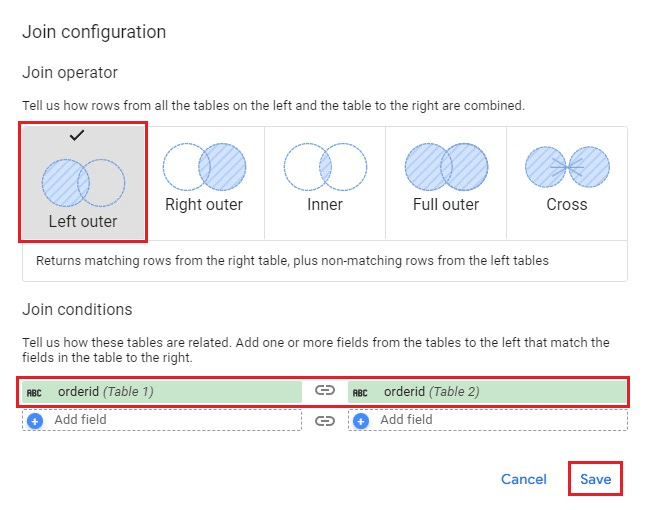
7 - In “Join Operator,” select the “Left outer” option, and under “Join Conditions,” select the dimension key for both tables and click “Save”;
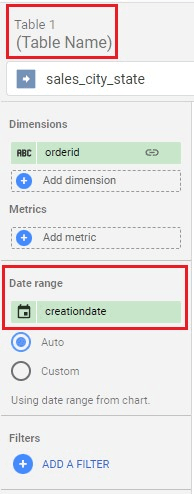
8 - Now, only in “Table 1,” click on “Date Range” and select the desired date option; in this case, we will use “creationdate”;
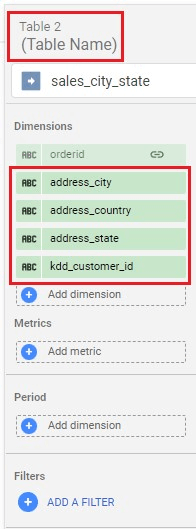
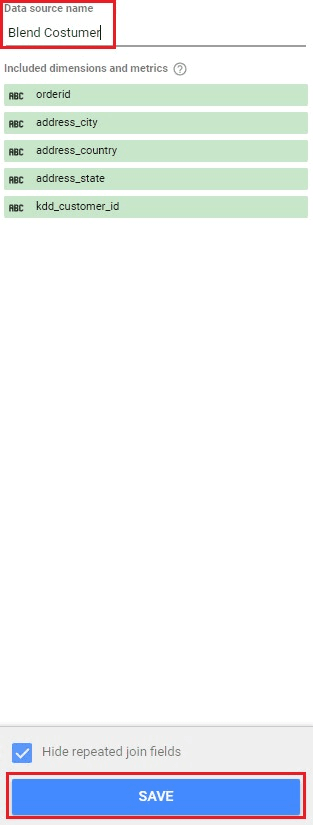
9 - Next, in “Table 2,” add in “Dimensions” the fields you want to use in the dashboard. Leave the period field blank!
10 - In “Data Source Name,” give a name that identifies the blend, then click “Save”.
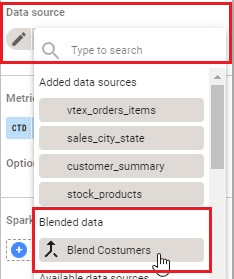
11 - Done! Now when creating a new chart on your dashboard, just select the created blend, and the “count distinct” will work correctly with a date filter.
Fix Count Distinct with Date Filter in Looker Studio via Kondado
Resolve the known Looker Studio bug where count distinct fails with date filters by creating a self-blend of your Kondado-connected table.
Open Blend Management in Looker Studio
In your Looker Studio report connected to Kondado data, click on Resource in the taskbar, then select Manage blends to begin creating the self-join fix.
Create a New Self-Blend
Click Add a Blend. In Table 1, select the table from your Kondado data integration that shows incorrect count distinct results—for example, "sales_city_state".
Configure the Left Outer Join
Click Join another table and select the same table again. In both tables, set the dimension key (e.g., "orderid") that will link them, then choose Left outer as the Join Operator and save the join conditions.
Set Date Range on Table 1 Only
In Table 1, add your date field (e.g., "creationdate") to Date Range. Leave Table 2's period field blank—this separation is what prevents the count distinct bug from triggering.
Add Dashboard Fields to Table 2
In Table 2, add all the dimensions and metrics you need for your data visualization. Name your blend descriptively and save it.
Apply the Blend to Your Charts
When building charts on your dashboard, select the newly created blend as the data source. Your count distinct calculations will now work correctly alongside date filters.