How to create a GA4 Report in Looker Studio

How to create a GA4 Report in Looker Studio

 If you use Google Analytics 4 (GA4), you know how challenging it can be to turn raw data into actionable insights. Kondado makes it easy with a  free GA4 report template for Looker Studio designed to give you a complete and organized view of your business's key metrics.

Here’s the complete guide to implementing our template and customizing it for your GA4 report in Looker Studio!

Follow these simple steps:

2 - Choose your report: Within minutes, Kondado will automatically configure everything and provide you with a link to view the report populated with your data.

Report Features

Our report is divided into three main pages:
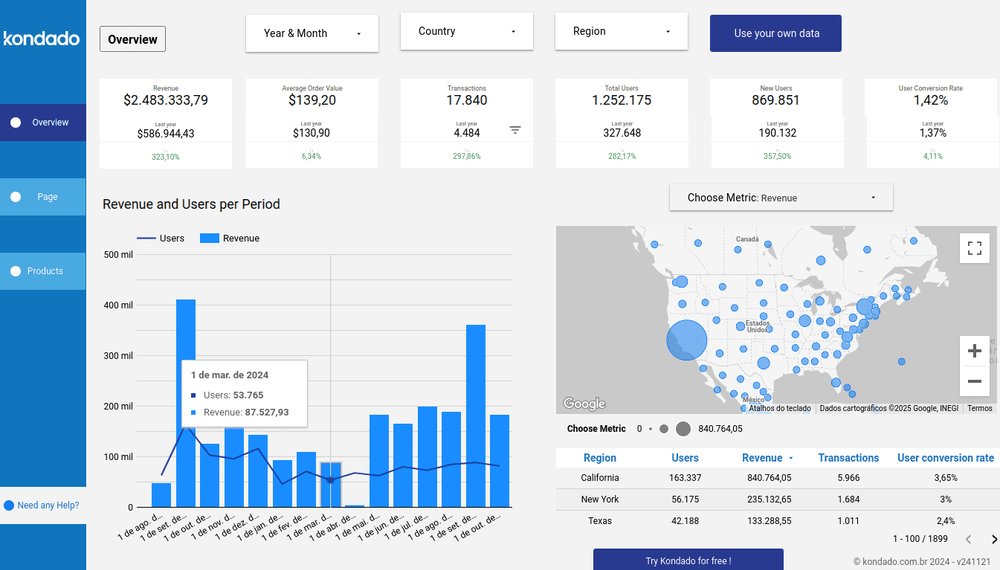
Overview Tab

Provides an overview of your business with key insights and metrics, such as revenue, users and user conversion rates, offering a quick understanding of your operation's performance.
Includes filters for period, country, and region, with the option to compare data with the same period from the previous year.

Pages Tab

Analyzes user interactions on your pages, featuring a sales funnel to clearly represent the customer journey, along with graphs of sessions by source/media and by standard channels. These insights help refine your engagement strategies.

Products Tab

Showcases product performance, including data like purchased items, revenue, views, and conversion rates. Identify your most profitable products and optimize results with the ABC graph analysis.

Report Metrics

Revenue and Users by Period Chart: A dual-axis graph that highlights the relationship between user volume and revenue over time.

Map Chart: Displays metrics like "New Users" and "Total Users" by region. Circle sizes on the map reflect relative metric values, making geographic analysis straightforward and detailed.

Sessions by Source/Medium Chart: Reveals which traffic sources drive the most visits, helping you refine acquisition strategies by analyzing session counts.

Products Table: Offers a detailed view of each product's journey, from initial view to purchase. It enables data-driven decisions to refine marketing strategies, improve product positioning, and boost sales by identifying top-performing items and areas for improvement.

GIF GA4 LOOKER STUDIO - PT E ENG.gif

Elevate your data analysis!

With Kondado  analyzing data has never been easier. Our platform empowers businesses of all sizes to turn data into actionable insights, improving decision-making and driving impactful results.

 Explore our GA4 report template in Looker Studio —it’s the tool you need to streamline your data analysis and make confident, data-backed decisions.

Create a GA4 Report in Looker Studio with Kondado

Use Kondado's free GA4 template to build a Looker Studio dashboard with revenue, users, pages, and conversions.

1
Sign up for Kondado

Create a free trial on Kondado or log in to your existing account.

2
Pick the GA4 report template

Select Kondado's GA4 report template for Looker Studio so the platform knows which source and template to set up.

3
Connect Google Analytics 4

Authorize Kondado to read your GA4 property, including users, sessions, revenue, and page-level metrics.

4
Wait for the automated setup

Kondado replicates the GA4 data and provisions the Looker Studio template. You'll be notified when the report is ready.

5
Customize the dashboard

Open the report in Looker Studio. Use the Overview, Pages, and Devices tabs and adjust period/country/region filters to compare current data against the previous period.

Frequently asked questions

How do I access Kondado's free GA4 report template for Looker Studio?
You can access the template by signing up for a free trial on Kondado or logging into your existing account. Within minutes, Kondado will automatically configure everything and provide you with a link to view the report populated with your data. You can also explore other ready-to-use report templates available on our platform.
What tabs are included in the GA4 Looker Studio report?
The report is divided into three main pages: the Overview Tab, which provides key metrics like revenue, users, and conversion rates with period, country, and region filters; the Pages Tab, which analyzes user interactions with a sales funnel and sessions by source/medium; and the Products Tab, which showcases product performance with data like purchased items, revenue, views, and conversion rates including ABC graph analysis.
What metrics does the GA4 report template track?
The template includes several key visualizations: a Revenue and Users by Period Chart showing the relationship between user volume and revenue over time; a Map Chart displaying new and total users by region with circle sizes reflecting relative values; a Sessions by Source/Medium Chart revealing which traffic sources drive visits; and a Products Table offering detailed views of each product's journey from view to purchase.
Can I compare current data with previous periods in the GA4 report?
Yes, the Overview Tab includes filters for period, country, and region, with the option to compare data with the same period from the previous year. This allows you to quickly understand your operation's performance trends and seasonal variations.
How does Kondado help with data visualization beyond GA4 reports?
Kondado offers comprehensive data visualization capabilities that empower businesses of all sizes to turn data into actionable insights. Our platform supports connecting various sources to destinations like BI tools, data warehouses, and spreadsheets, improving decision-making and driving impactful results across your entire data stack.
Is there a free trial available to test the GA4 Looker Studio template?
Yes, you can try Kondado for free for 14 days. During this trial, you can access the GA4 report template in Looker Studio and experience how our platform streamlines data analysis. Sign up through our free trial registration to get started and take your results to the next level.

Written by·Published 2025-01-27·Updated 2026-04-26