Follow these steps:
1- Sign up for a free account on Kondado or log in if you already have one.
2- Then, choose your preferred report, and Kondado will automatically configure everything in moments, providing you with a link to view your report with all your data inserted.
Report Features
The report is organized into two main pages:
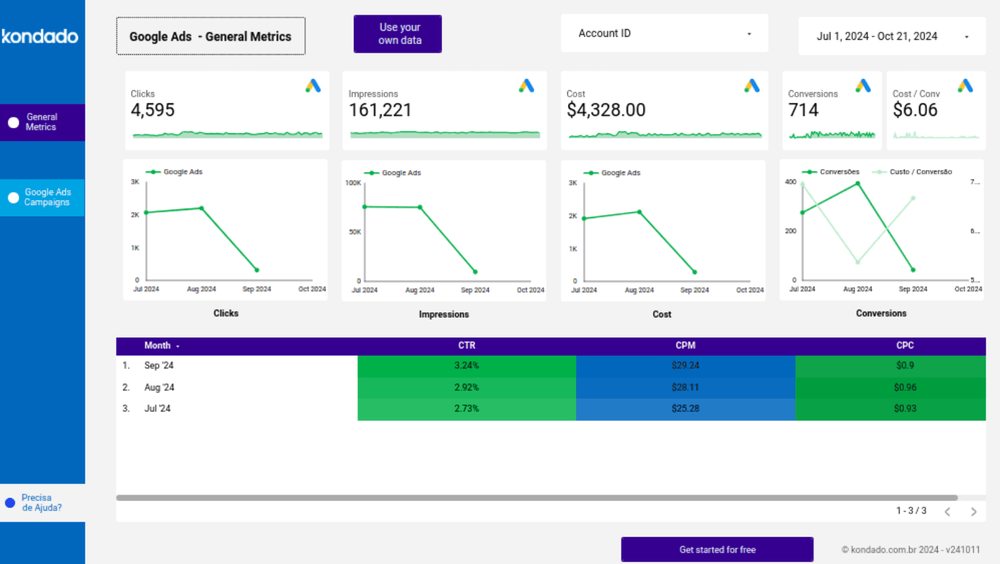
General Indicators Page
Offers an overview of key metrics to assess Google Ads campaign performance, allowing you to track clicks, cost, impressions, and click-through rate (CTR).
Google Ads Campaigns Page
Contains a detailed summary of your campaign metrics, with filters for ad account, campaign name, and date, along with the key metrics mentioned above.
Report Metrics
We have selected the most important metrics for our report to help you monitor and understand the performance of your Google Ads campaigns. These are crucial for evaluating and adjusting your strategies effectively. Here are the key metrics:
- Clicks: The total number of times users clicked on your ads during the selected period.
- Impressions: The number of times your ads were displayed across your campaigns.
- Cost: The total amount spent on all campaigns within the defined period.
- CTR (Click-Through Rate): The percentage that shows the ratio between clicks and impressions.
- CPM (Cost per Thousand Impressions): The estimated cost for every thousand times your ad was shown.
- CPC (Cost per Click): The average amount paid for each click, calculated by dividing the total cost by the number of clicks.
![[GIF ENG] FACEBOOK ADS POWER BI.gif](https://kdd-public-files.s3.amazonaws.com/GIF_ENG_FACEBOOK_ADS_POWER_BI_822d5672b3.gif)
Experience the simplicity of building a customized report with Kondado
Conclusion
With Kondado’s report, you have an efficient and personalized solution to track the performance of your Google Ads campaigns. Metrics such as impressions, cost, and CTR are organized in a user-friendly way, enabling you to make strategic decisions and optimize your results.
Create a Google Ads Report in Looker Studio with Kondado
Use Kondado's pre-built Google Ads dashboard to launch a Looker Studio report covering campaign-level performance — populated with your own ad account data.
Pick the Google Ads Looker Studio template
Inside Kondado, choose the Google Ads Looker Studio report. The platform configures the source, destination and pipeline automatically and returns a link to your populated dashboard.
Review the General Indicators page
Open the General Indicators page to see overall clicks, cost, impressions and CTR for the period you select.
Drill into campaigns
Use the Google Ads Campaigns page to filter by ad account, campaign name and date, and to inspect CTR, CPM and CPC at the campaign level.
Customize and share
Adapt the template to your own taxonomy and share it with stakeholders. See the complete guide for advanced customization options.