
How to Create a VTEX Report in Power BI
In summary, the steps are as follows:
2- Select the report option you want, and you're all set! Kondado will create everything for you automatically and provide a link at the end for you to view the report model with your own data.
Report Features
The report is divided into seven pages, which include:
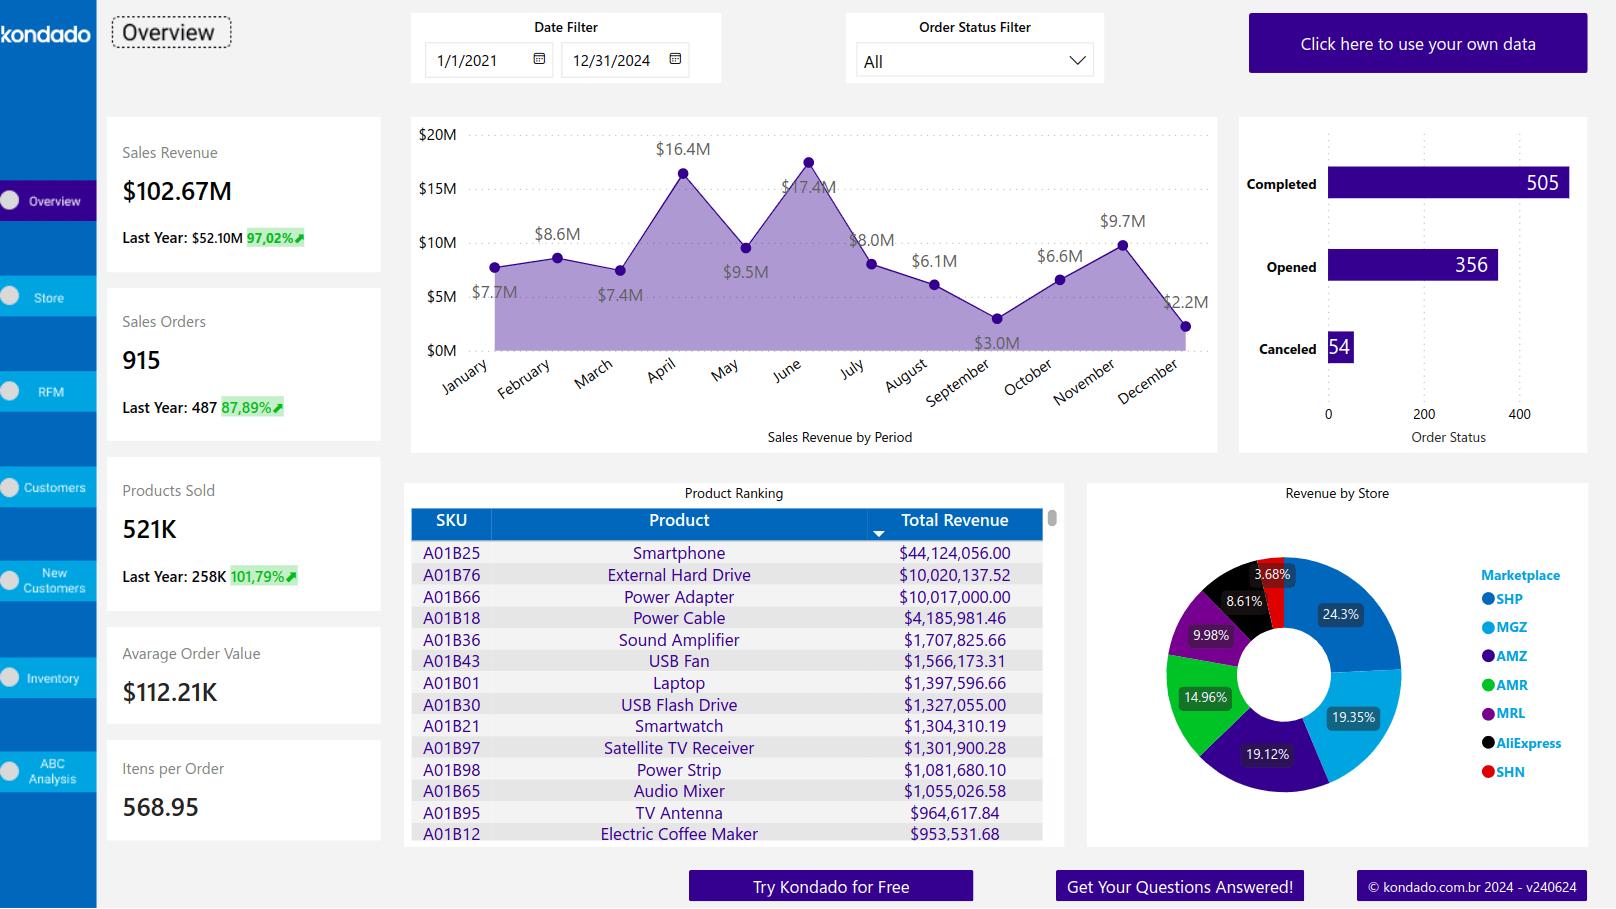
Overview Page
The initial page provides an overview of key business insights and metrics, ranging from date range and order status filters to product revenue charts over periods and product ranking tables. Thus, it can be used as a starting point to quickly and clearly understand the main focus points of the company.
Stores Page
Shows revenue scorecard, average order value, and monthly orders by store.
RFM Page
Performs RFM analysis of customers. It is a customer segmentation technique used in marketing and data analysis to identify and categorize customers based on their buying behaviors considering Recency, Frequency, and Monetary Value in purchases.
Customers Page
Provides easily accessible information about consumers, such as revenue by state, revenue by city, active customers scorecard and served cities scorecard.
New Customers Page
Quantifies new and base customers per filtered period. It is possible to filter a specific period to analyze the result of a marketing campaign, for example.
Inventory Page
Presents inventory information, including filters such as Warehouse Name, Refid, among others.
ABC Curve Page
Displays information about the ABC Curve of products sold by the company in a table format. It has two tabs, the first being by SKU and the second by category, allowing different analyses to be performed for each type of business.
Report Metrics
Store Analysis: Table listing all Stores that had sales in the selected period, detailing product revenue, average ticket, and number of orders.
Class Filter: Used to show only one of the product classes A, B, or C. Customer Filter: Allows searching by customer name.
Warehouse Name Filter: Allows selecting the warehouse name where you want to perform the search.
Monthly Sales Revenue by Store (R$): Visual representation in a pie chart showing the percentage of sales by store. It can vary according to the selected period and order status.
Product Revenue by Period Chart: Visually presents the evolution of company revenue over time.
Items per Order: Displays the average quantity of items per received order.
Monthly Orders by Store (%): Filter showing the percentage quantity of orders received per store in the selected period.
Revenue by Customer: Table with product revenue information, quantity of items, and quantity of orders per customer, according to the selected filters.
Product Ranking Table: Table ranking by Total Revenue of products that had the most revenue in the selected period.
Transform Your Business Results with Kondado
At Kondado, we simplify data analysis with a dynamic platform designed to help businesses of all sizes gain insights that enhance their strategies.
Check out our VTEX report model in Power BI today! With it, you can analyze your sales by store, segment customers, customize filters and views according to your needs, monitor product performance, and much more!
Conclusion
The VTEX report model in Power BI created by Kondado offers an efficient and practical solution for data management. With various features and pages such as Summary, Stores, RFM, Customers, New Customers, Inventory, and ABC Curve, you obtain a detailed and segmented view of your business. The available metrics and filters allow you to customize data visualization, facilitating strategic decision-making.
Create a VTEX Report in Power BI with Kondado
Replicate VTEX data with Kondado and use the ready-made Power BI template to build your store report.
Pick the VTEX Power BI report
From Kondado's report templates, choose the VTEX report for Power BI so the platform knows which sources and pipelines to set up.
Connect your VTEX account
Authorize Kondado to read your VTEX data — orders, customers, products, and store information needed by the report.
Wait for the automated setup
Kondado provisions the destination, runs the initial replication, and prepares the Power BI template. You'll be notified when the data is ready.
Open the Power BI template and customize
Download the Power BI template, connect it to the database Kondado populated, and adjust filters (date range, order status, warehouse, ABC class) to fit your store. Use the Overview, Stores, RFM, Customers, and New Customers pages to drive decisions.