
Introduction to Looker Studio
Looker Studio is a powerful data analysis platform that offers robust tools for creating custom visualizations and reports. One of its essential features is filters, which allow users to control which data is displayed and analyzed in their reports.
The Importance of Filters
Filters in Looker Studio play a crucial role in enabling users to adjust and refine their data according to specific criteria. They facilitate focused analysis, helping extract relevant insights and make informed decisions.
Creating Filters for Charts
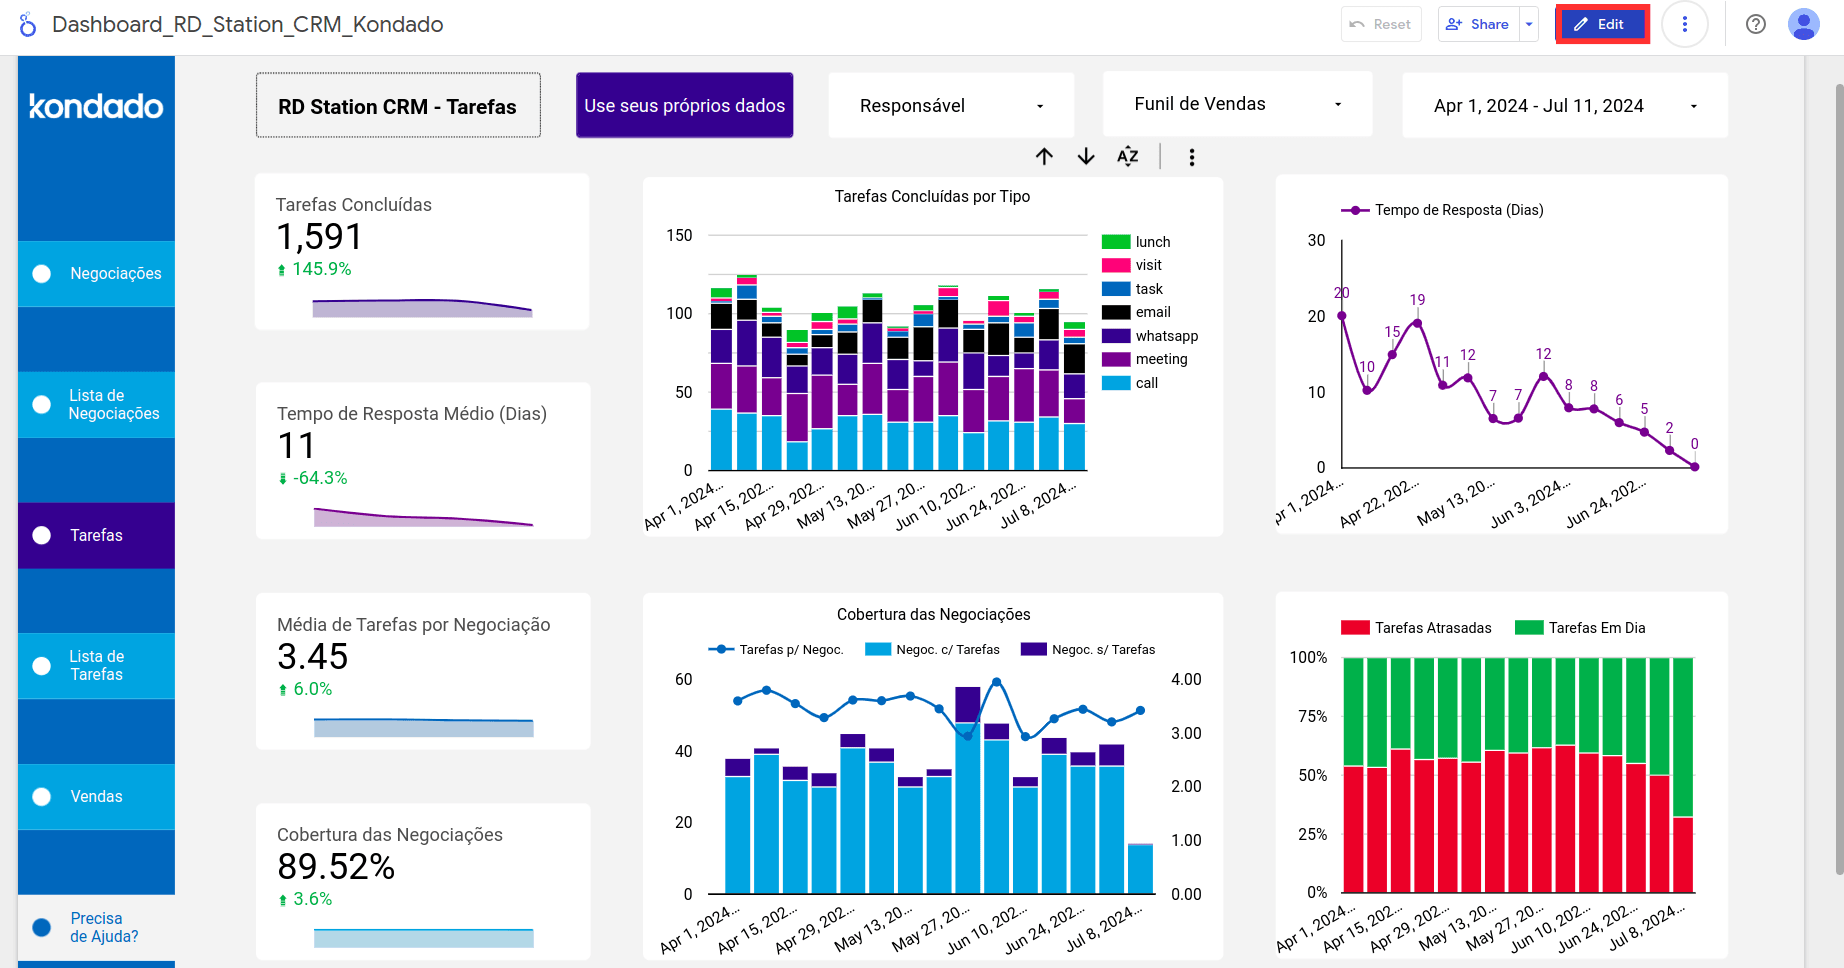
1- Open your project in Looker Studio.
2- Click on Edit
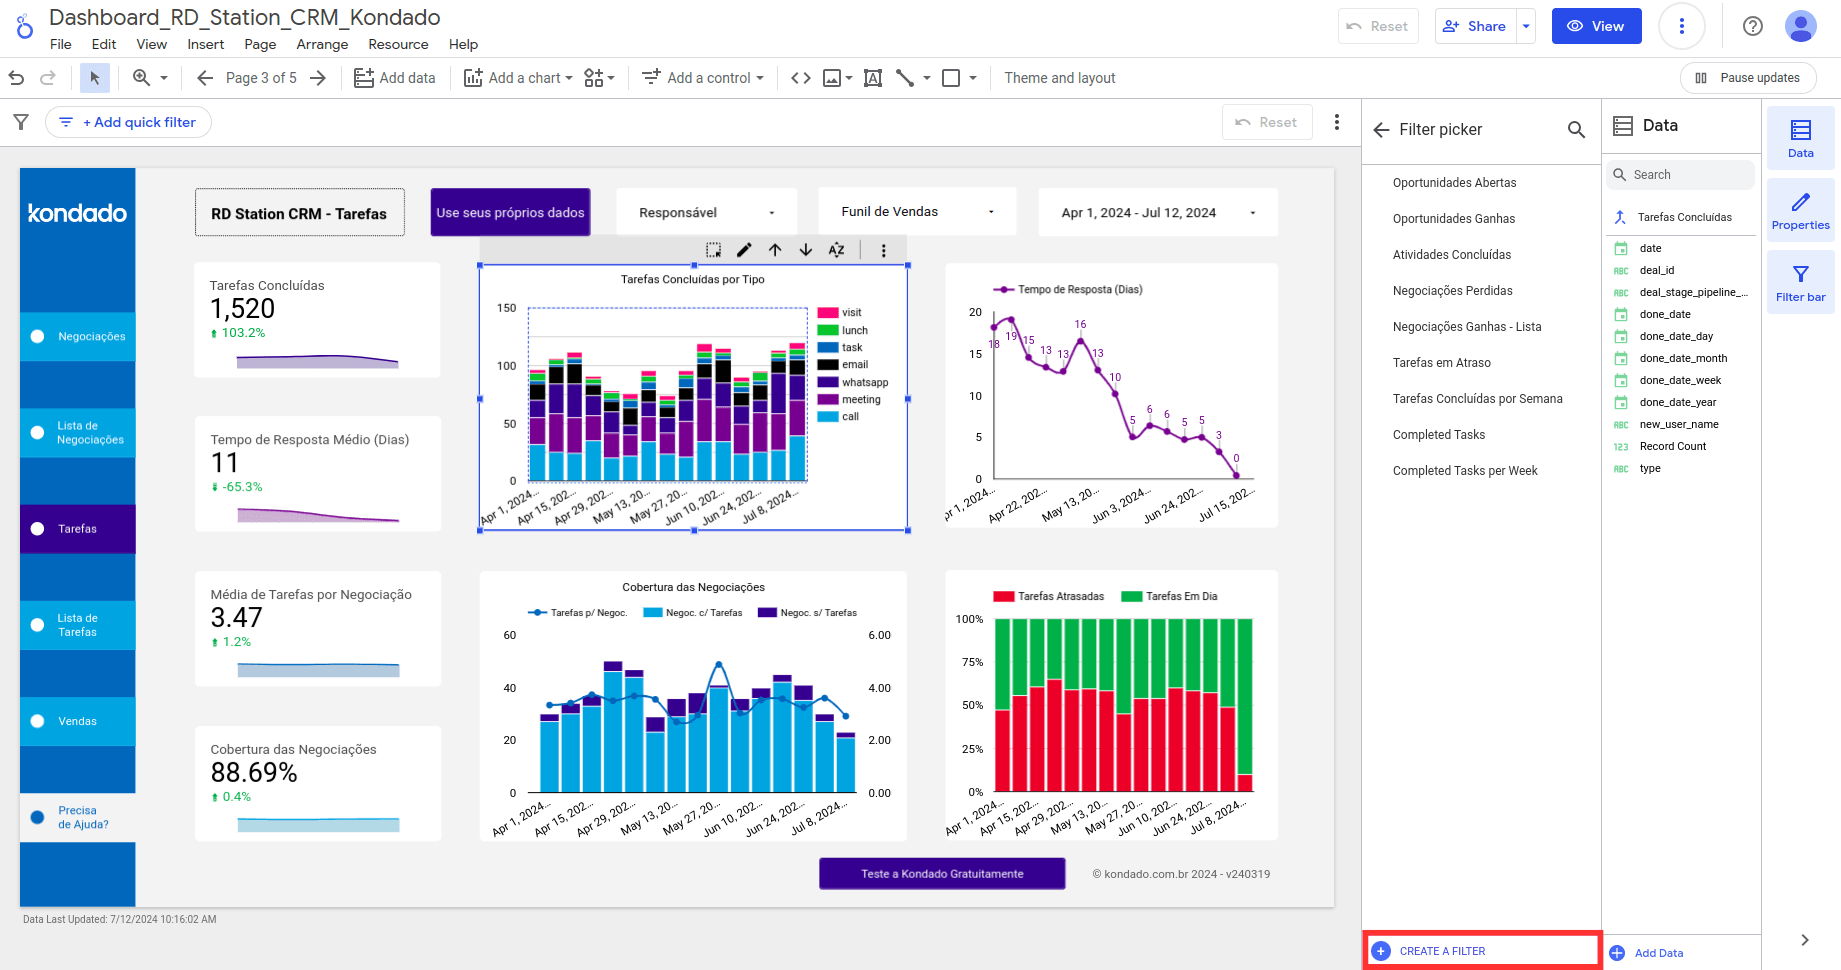
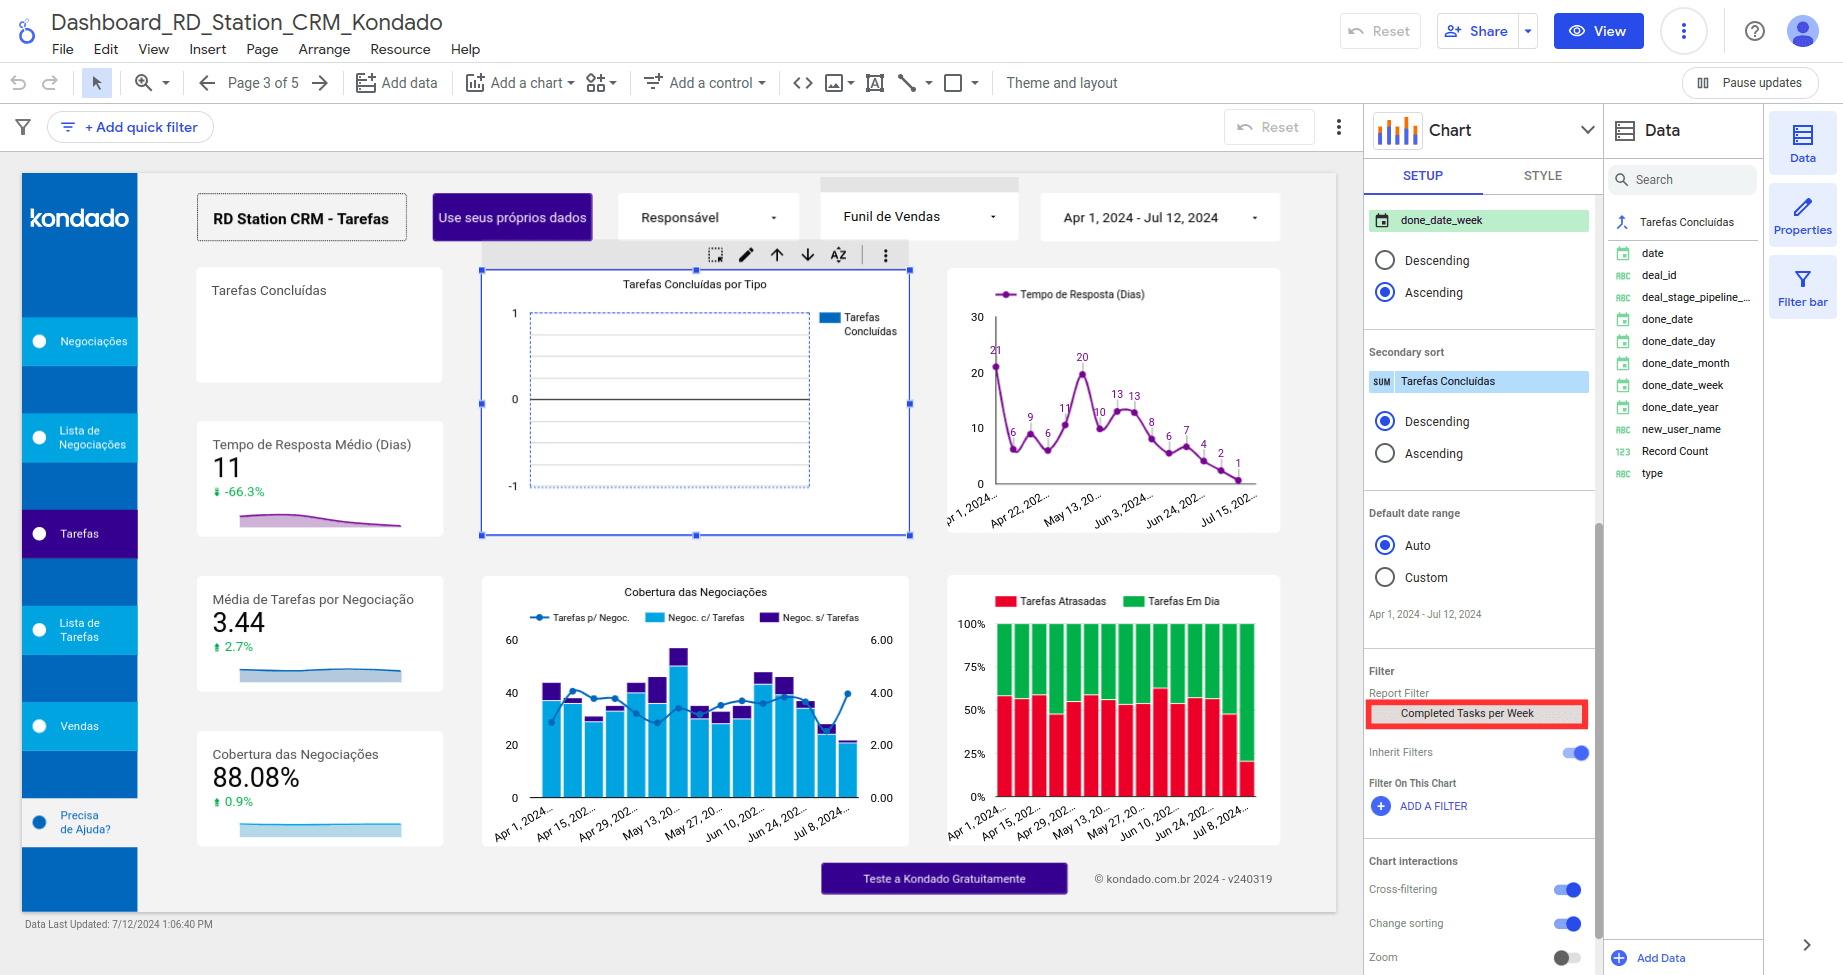
3- Click on the chart you want to add the filter to. In the Filter picker, select "Create a filter".
4- Configure the filter
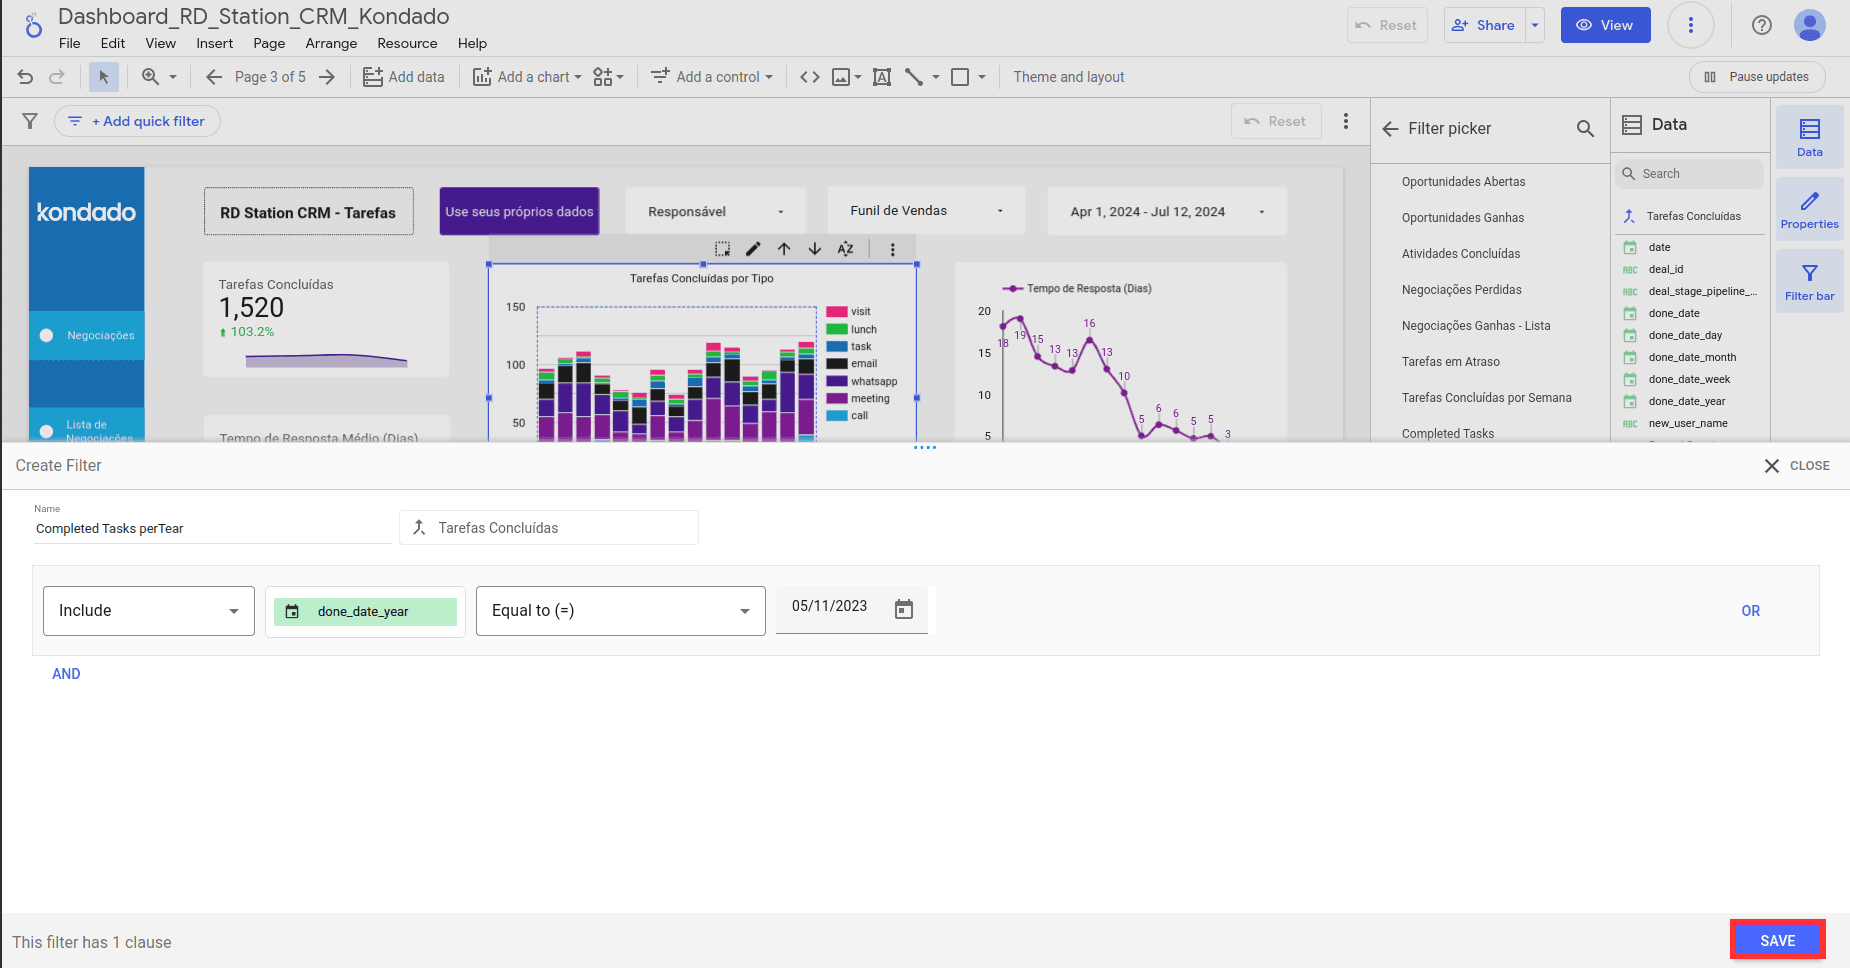
5- Click "Save" and see your filter in the chart properties and on the home screen.
Creating Filters for Pages or Reports
1- Open your project in Looker Studio.
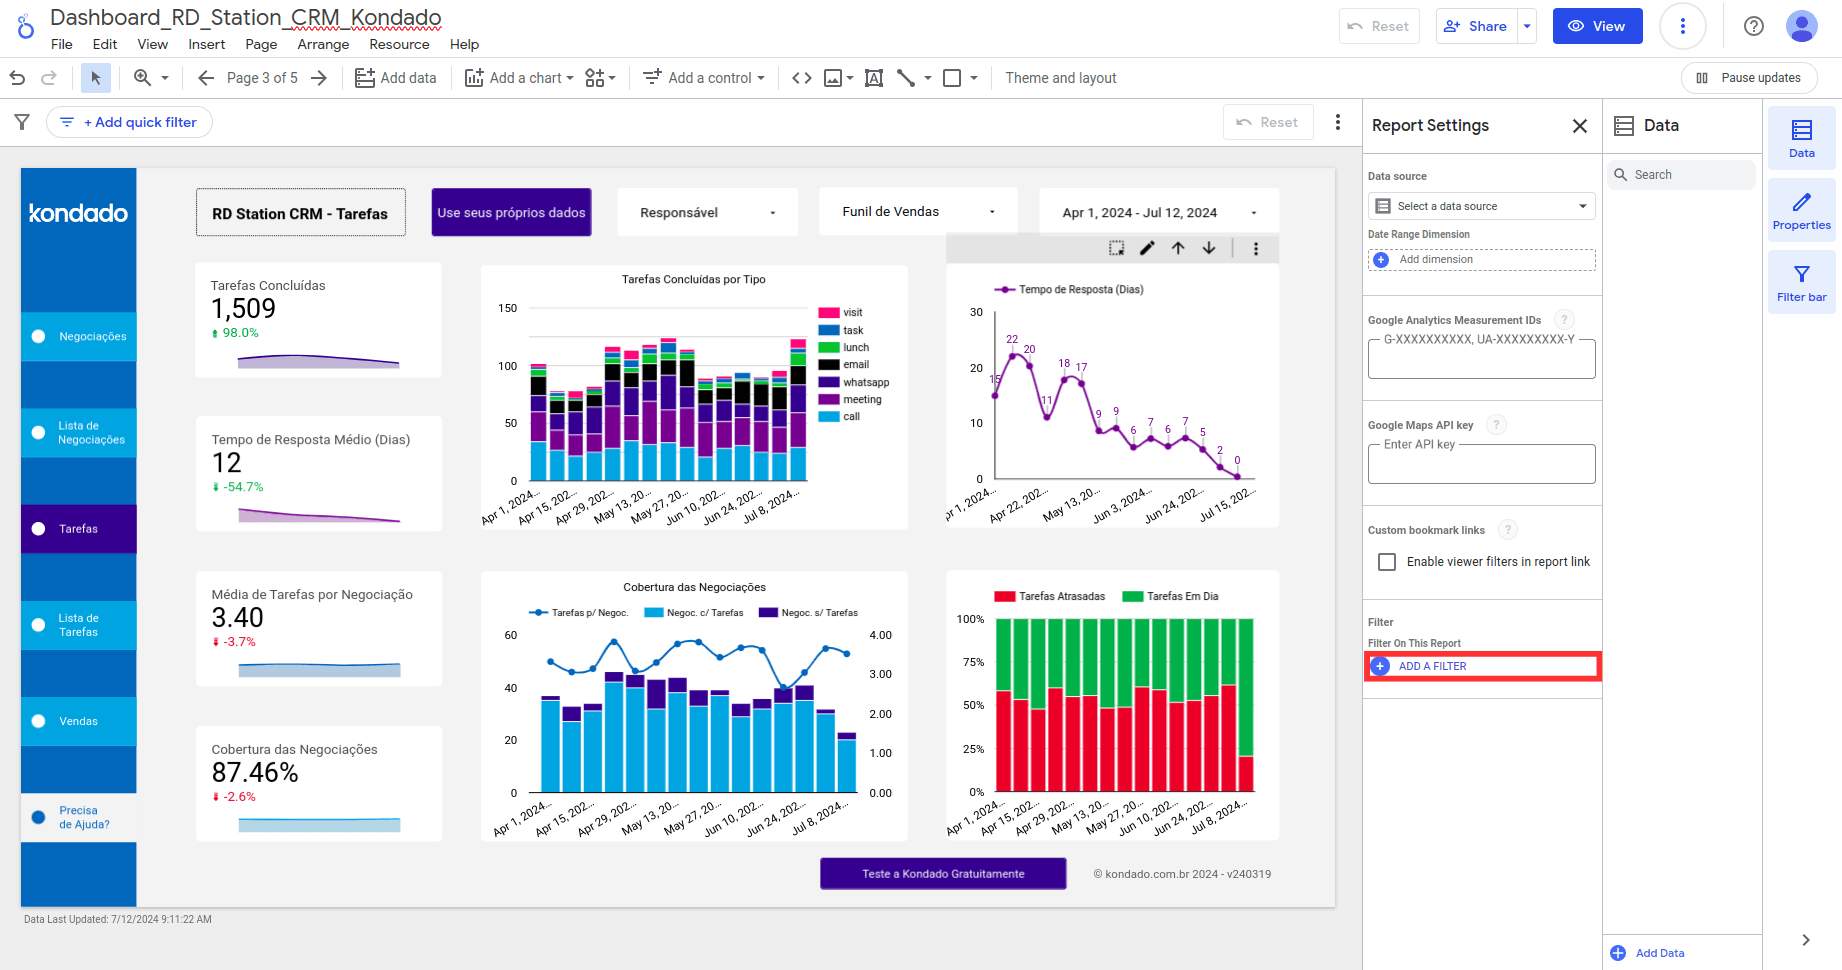
2- Navigate to the report editing panel and click on "Files" and then "Report Settings."
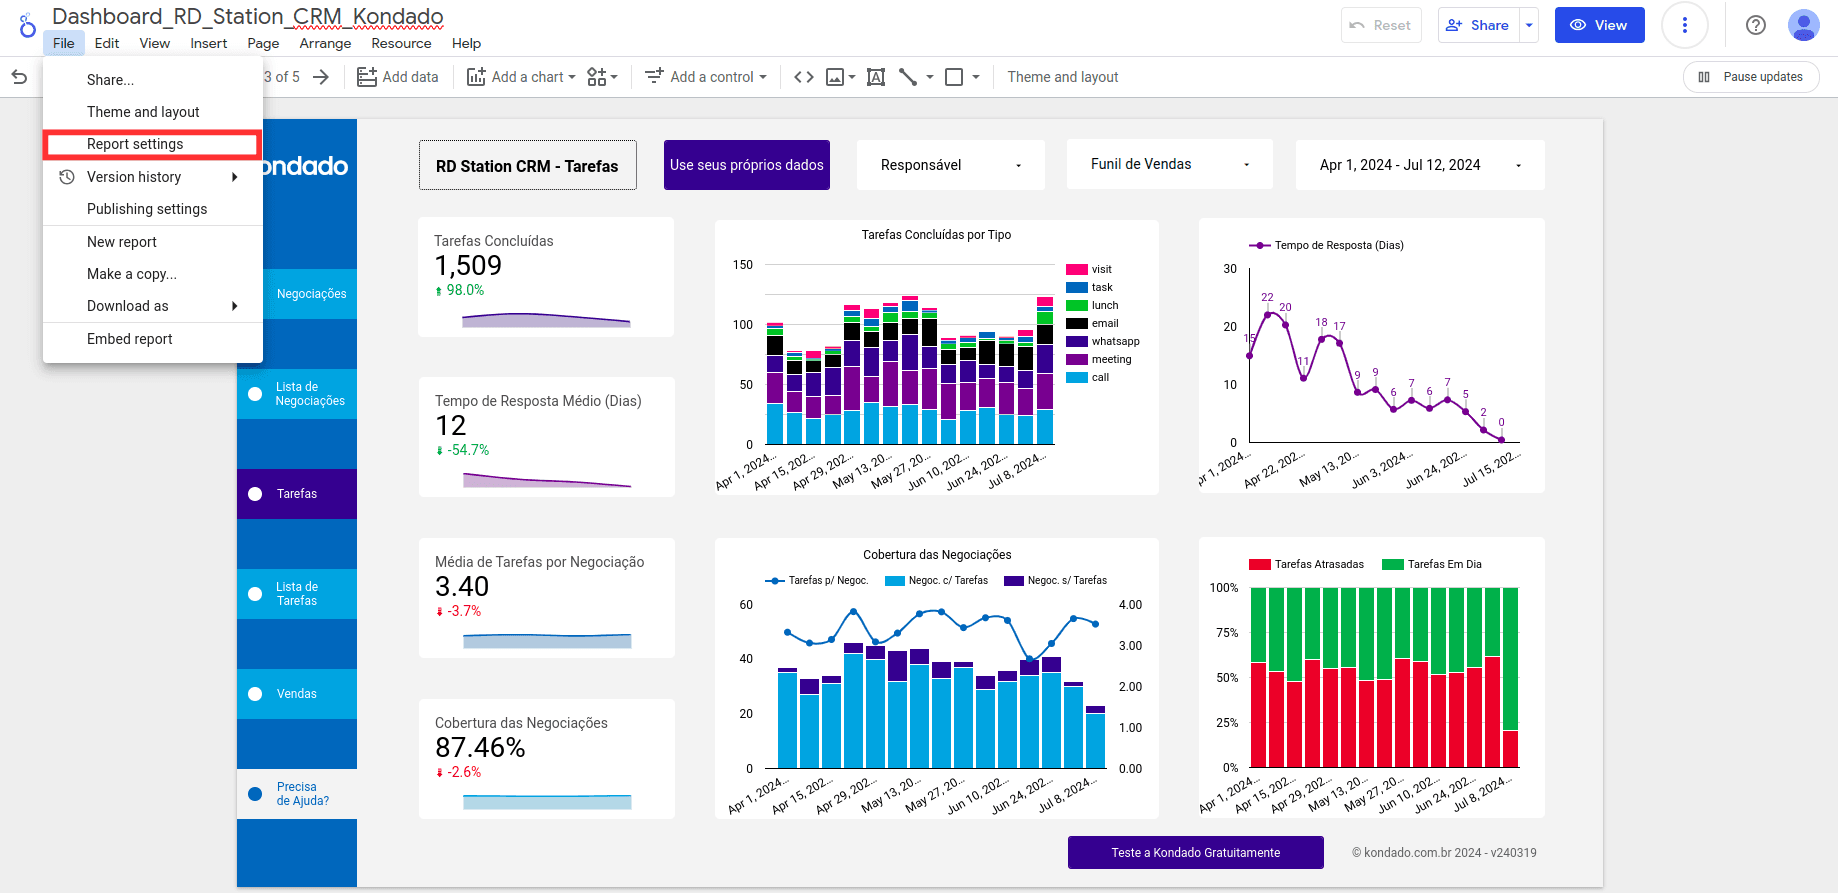
3- Click on "Add a filter."
4- Configure your filter.
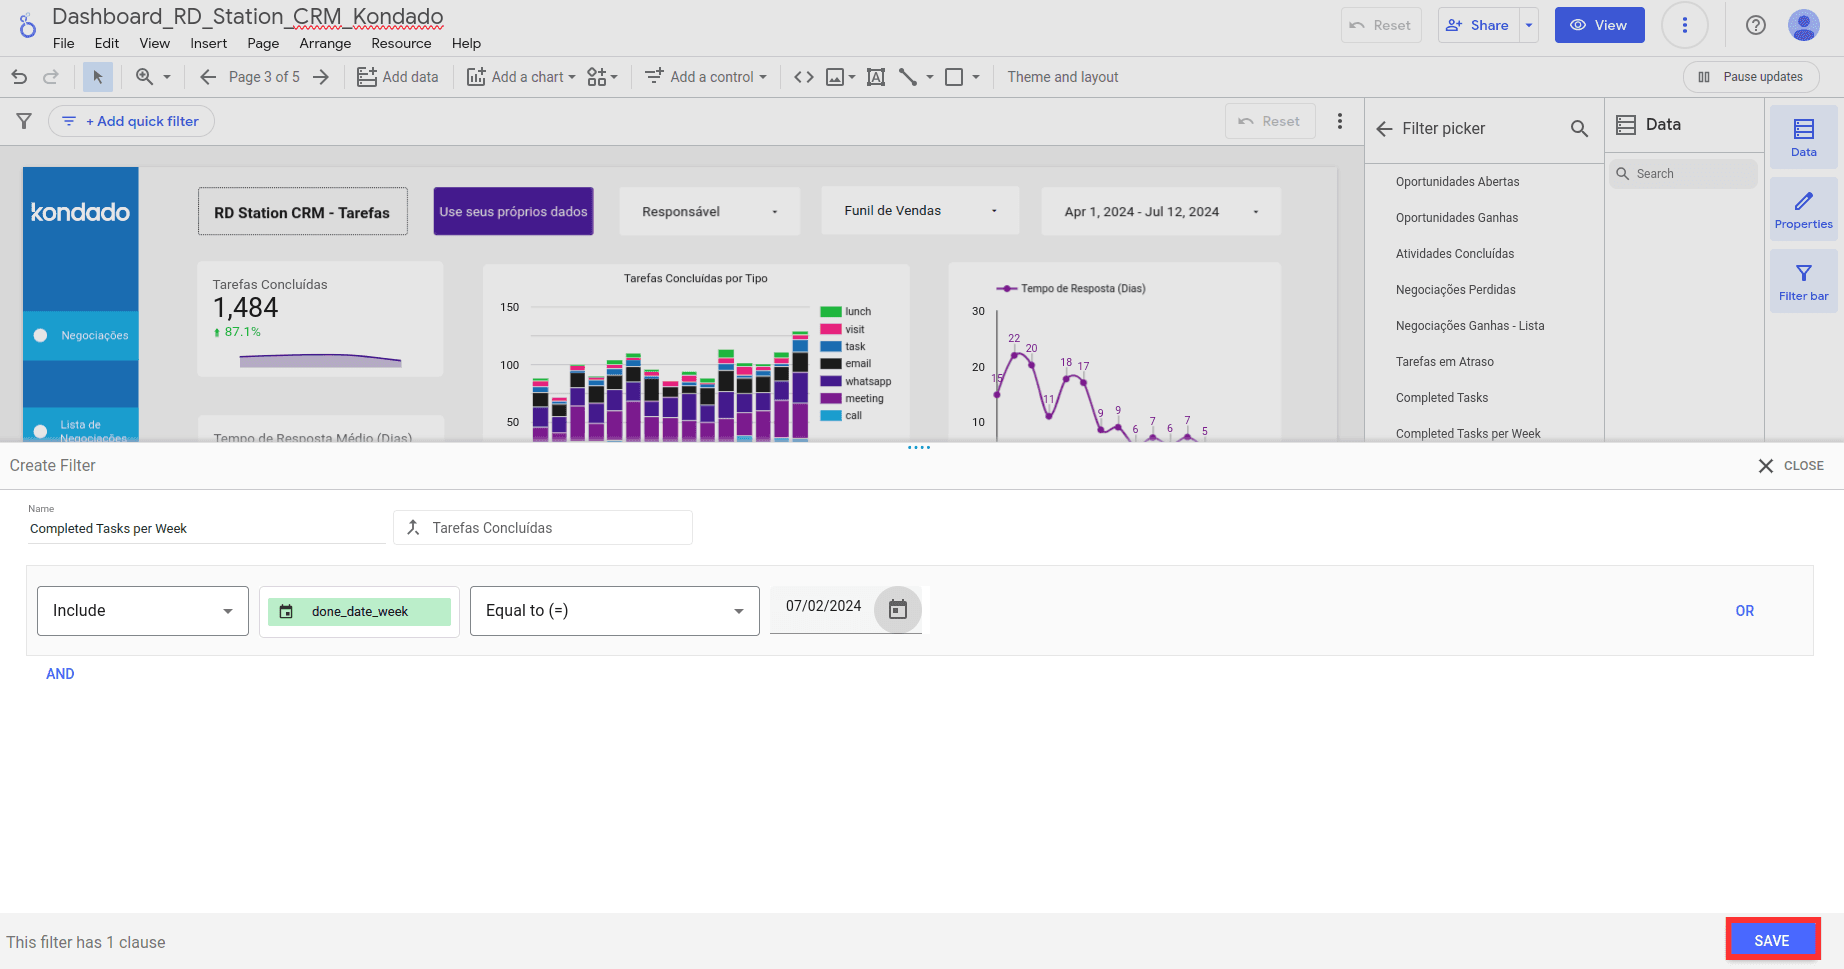
- Choose the metric by which you want to filter the data.
- Select the comparison operator (like "Equal to," "Contains," "Greater than," etc.).
- Enter a comparison value for the expression.
- (Optional) To add an OR clause, click OR to the right of the condition, and to add an AND clause, click AND below the condition.
5- Click "Save" and see your filter in the chart properties and on the home screen.
Managing Your Filters
Editing Existing Filters
To modify an existing filter, return to the editing panel and adjust its settings as needed.
Removing or Disabling Filters
If you no longer need a filter, you can remove it completely or temporarily disable it without deleting its settings.
Creating Advanced Filters
Explore advanced features to create combined or dependent filters that offer greater flexibility in data analysis.
At Kondado, we simplify data analysis with agile tools and integrations that require no programming, designed to facilitate connections and help businesses of all sizes gain insights.
Transform Your Data Analysis
See how filters in Looker Studio can easily transform your data analysis at Kondado! Start optimizing your reports today with custom filters and make strategic decisions based on precise insights. We invite you to discover how our platform can revolutionize how your company uses Looker Studio.
Conclusion
Filters in Looker Studio are powerful tools that allow users to customize their data analysis precisely and efficiently. By mastering the creation and management of filters, you can explore deeper insights and make strategic decisions based on reliable and relevant data.
Create and Manage Filters in Looker Studio
Learn how to build, configure, and maintain filters for charts and reports in Looker Studio to refine your data analysis.
Open your project and enter edit mode
Open your Looker Studio project and click Edit to access the report editing panel where filters can be created and modified.
Create a filter for a specific chart
Select the chart you want to filter, open the Filter picker, and choose Create a filter. Configure the conditions and click Save to apply it to that chart only.
Create a filter for an entire page or report
Navigate to Files > Report Settings, click Add a filter, then define the metric, comparison operator, and value. Use OR and AND clauses for complex conditions.
Edit, disable, or remove filters as needed
Return to the editing panel to adjust existing filters, temporarily disable them without losing settings, or remove them completely when no longer needed.
Explore advanced filter combinations
Build combined or dependent filters for greater flexibility in analysis. For deeper data visualization capabilities, consider how integrated platforms can enhance your Looker Studio workflows.