
Power BI, developed by Microsoft, is one of the most popular and powerful platforms for data analysis and creating interactive visualizations. In this article, we’ll explore what Power BI is, the different types of reports you can create, a step-by-step guide to building a report, and how to integrate Kondado data directly into Power BI.
What is Power BI?
Types of Reports in Power BI
Reports are panels that consolidate visualizations created from reports. They provide an overview of key performance indicators (KPIs) and critical metrics for an organization. Here are some main types of reports you can create in Power BI:
- Operational Reports: Focused on monitoring daily operations, presenting real-time data for quick decisions.
- Strategic Reports: Used for long-term analysis, focusing on strategic goals and overall company performance.
- Analytical Reports: Provide detailed views of historical data and forecasts, used for in-depth analysis and trend-based decision-making.
- Tactical Reports: Designed for managers to monitor team or department performance.
How to Create a Report in Power BI with Kondado
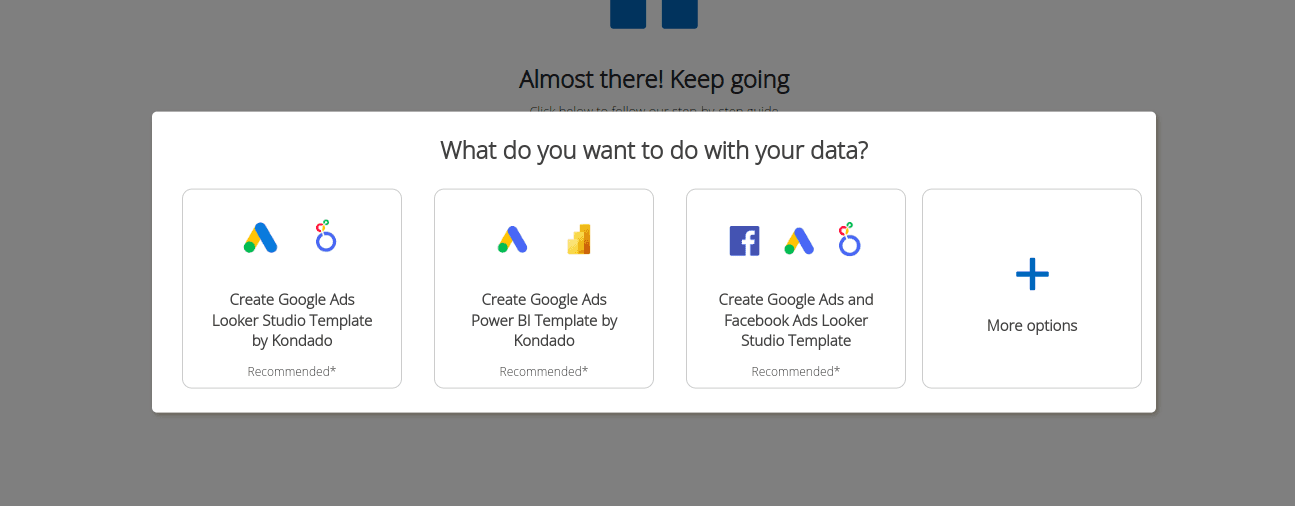
First Method - Using a Ready-Made Report Template
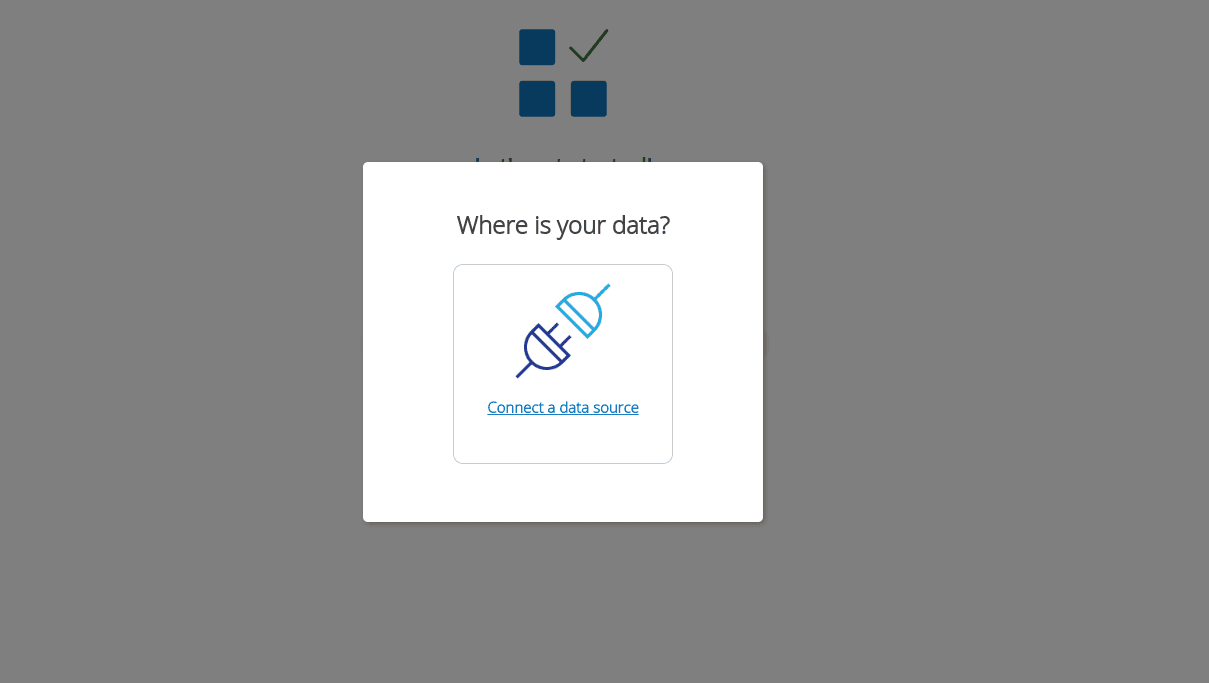
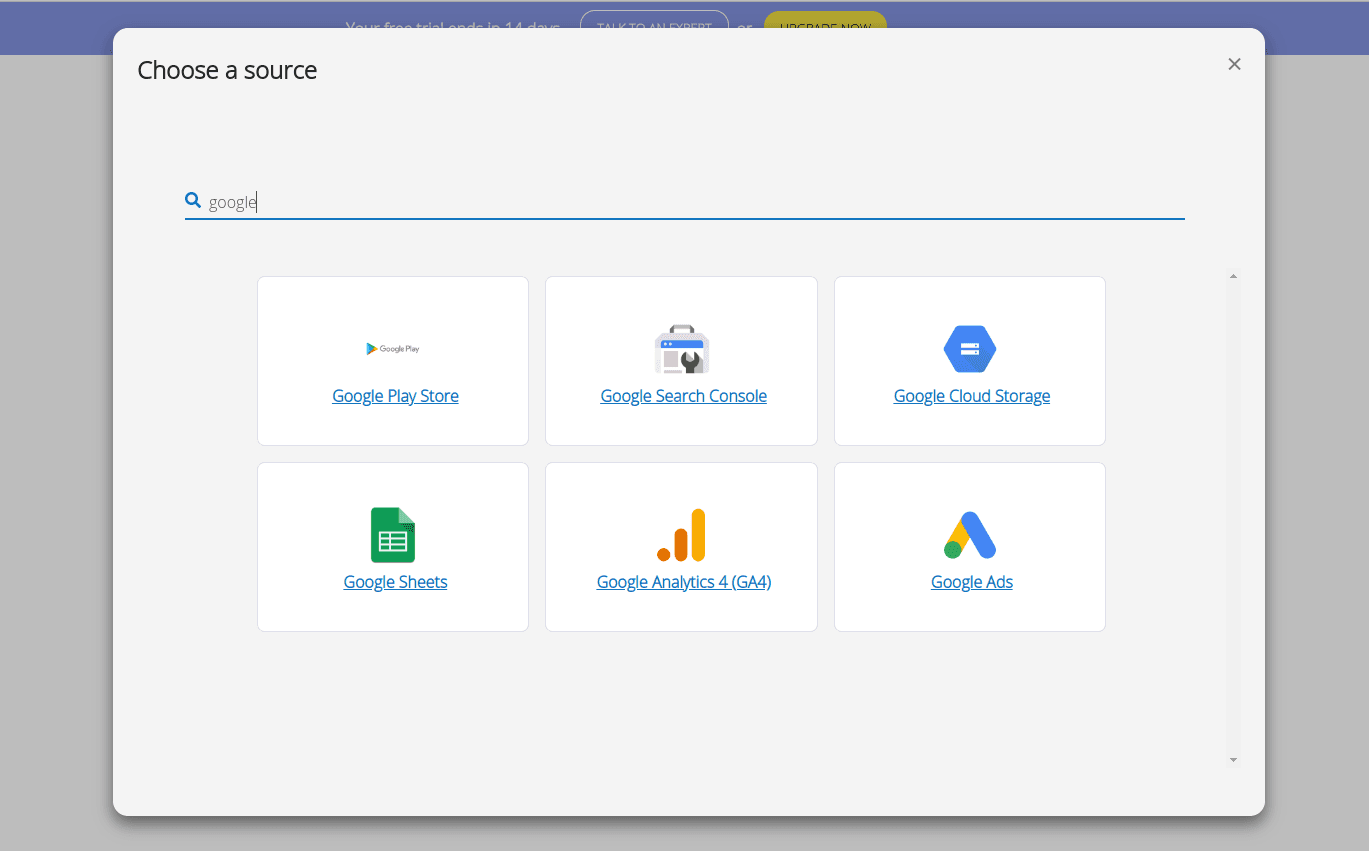
- On the Kondado platform, select your data source and follow the instructions to add it.
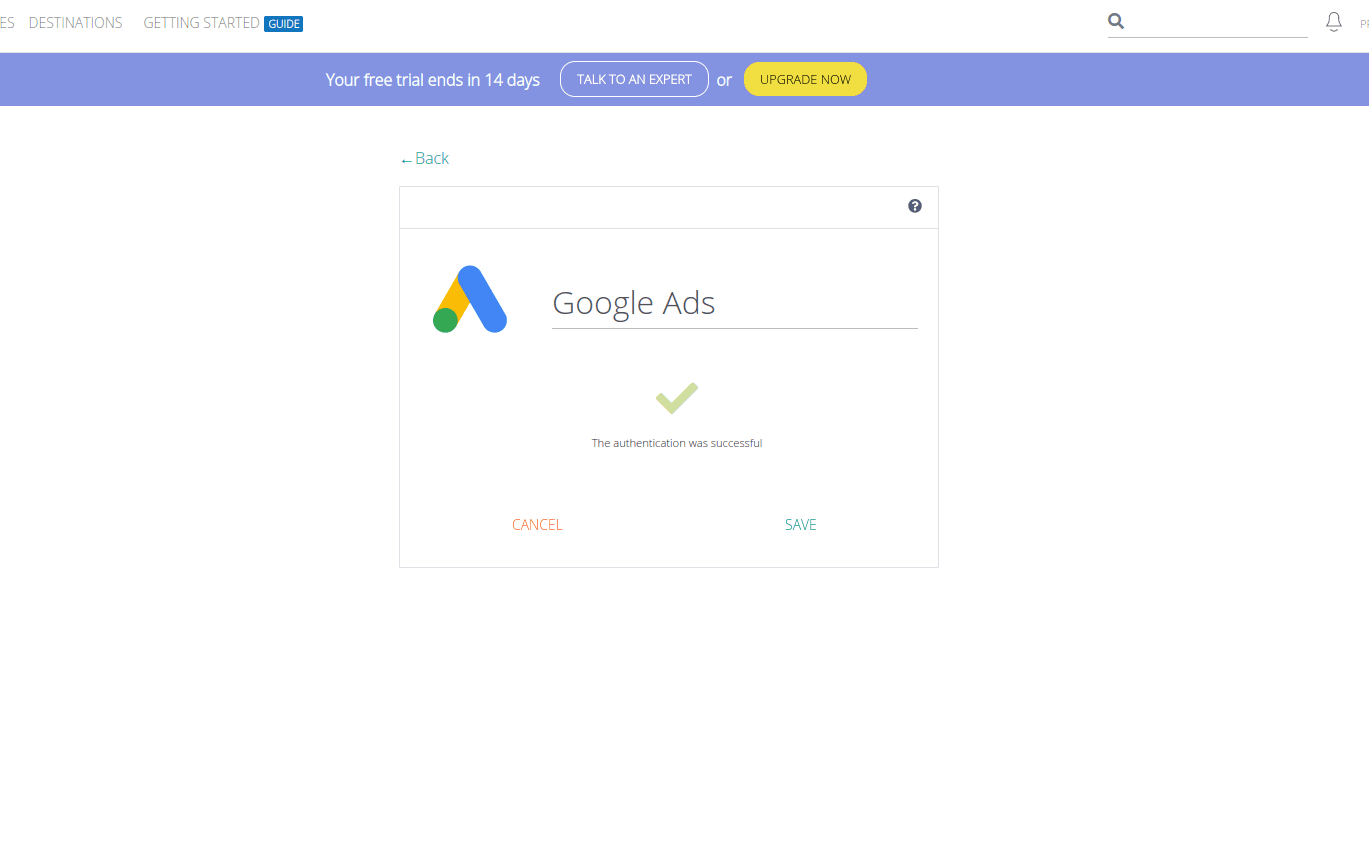
- After adding the data source, save the settings and wait for the connection test to complete. If successful, proceed to the next step.
- You’ll then be presented with ready-made report options for your data source.
- Choose the pre-built report option you'd like, and the platform will set up the pipelines for you. Once it's ready, you'll receive an email with instructions on how to use it.

Second Method - Creating Your Own Power BI Report
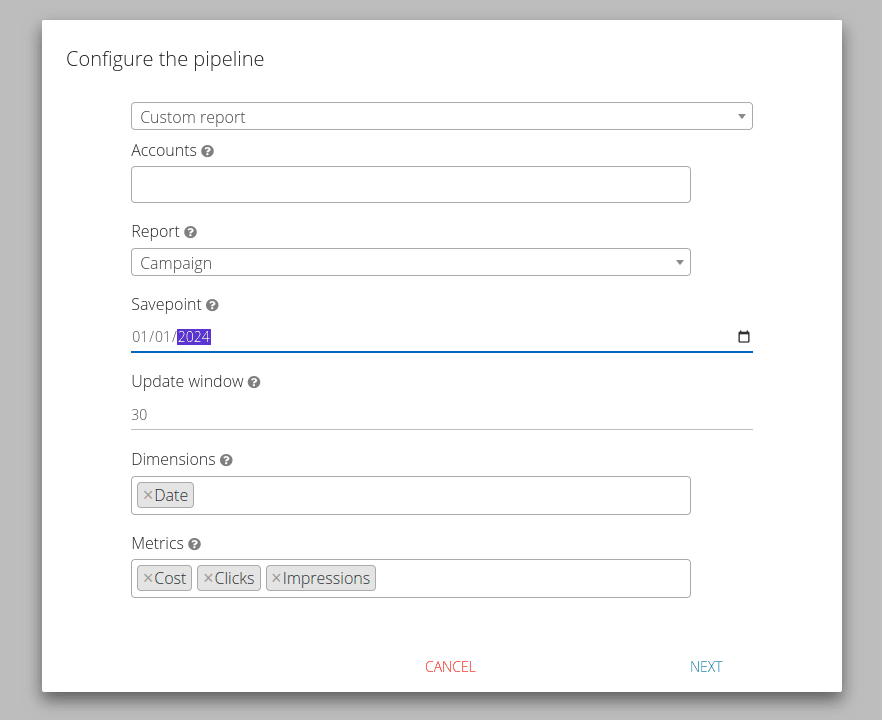
- Log in to the platform, select your data source, and follow the instructions to add it.
- After adding your data source, save it and wait for the connection test to complete. If successful, continue to the next step.
- Click on “More options” and choose “Connect to Power BI, Looker Studio, or a similar tool.”
- Follow the platform’s steps to create your pipeline.
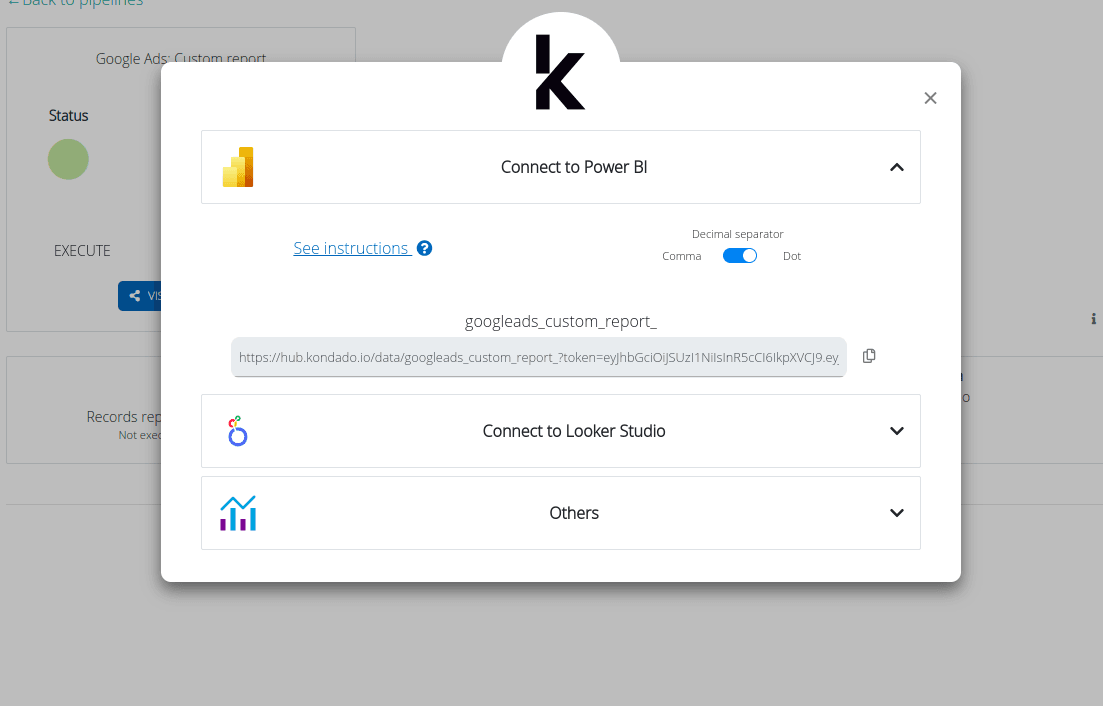
- Once your pipeline is saved and executed, you’ll see options on your screen. Select “Connect to Power BI.”

- You will now have access to a link to enter into Power BI to visualize your data. To know where to insert the link in Power BI, click on "See instructions."
Kondado Report Templates
We’ve selected some of our ready-made templates, which can be easily integrated and customized to suit your needs. They are perfect for those looking to save time and gain practical insights. Check out some examples below:
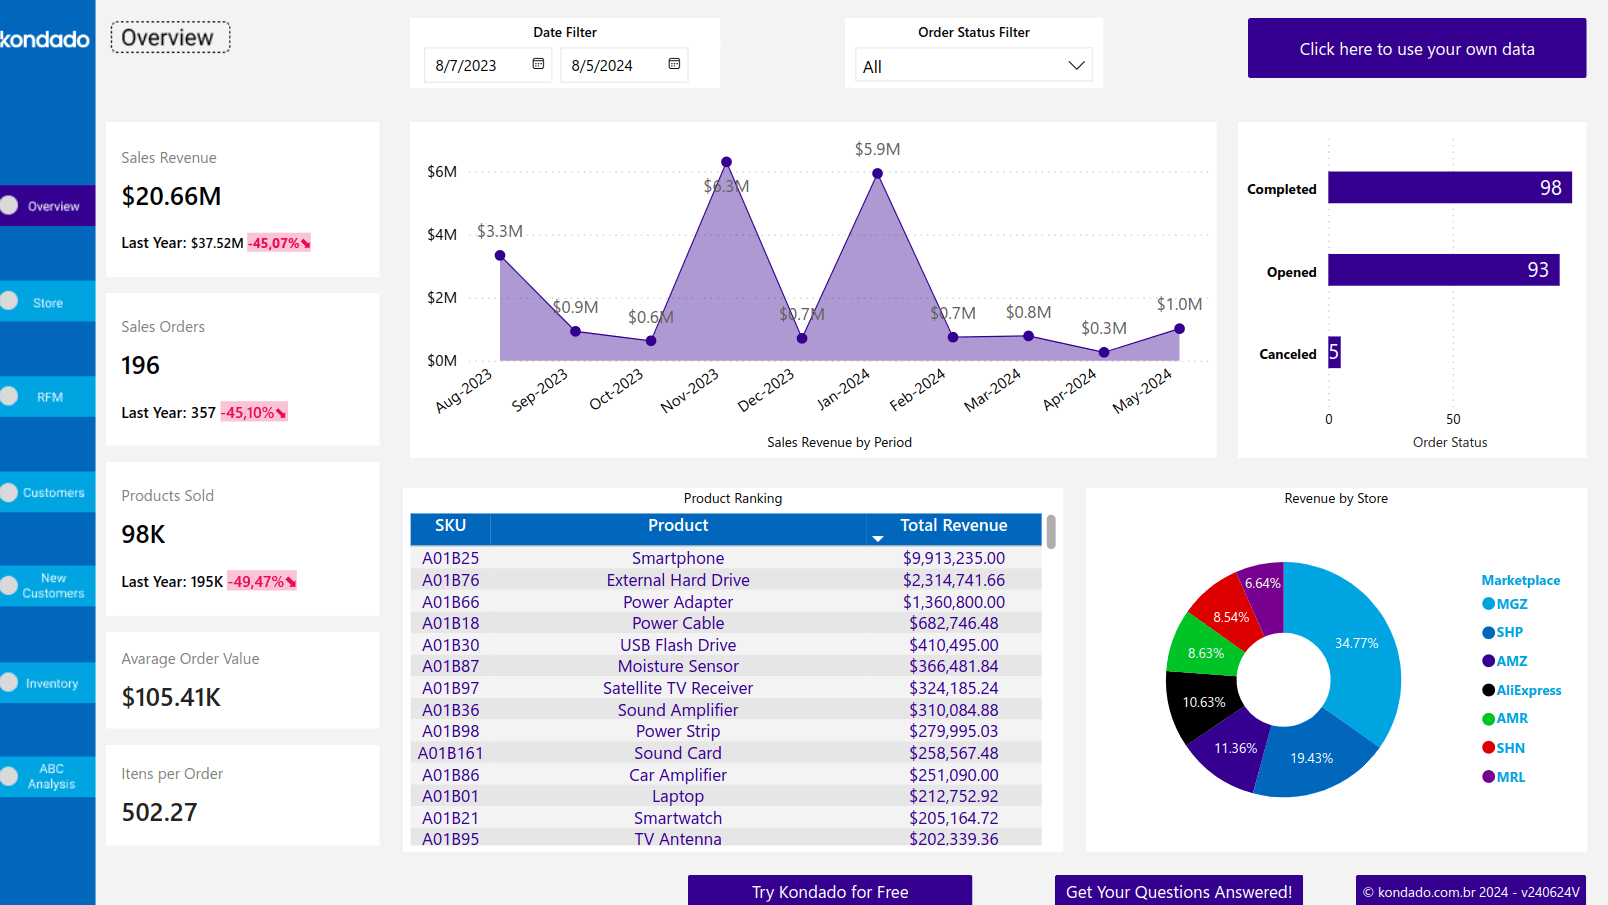
VTEX
Facebook Ads
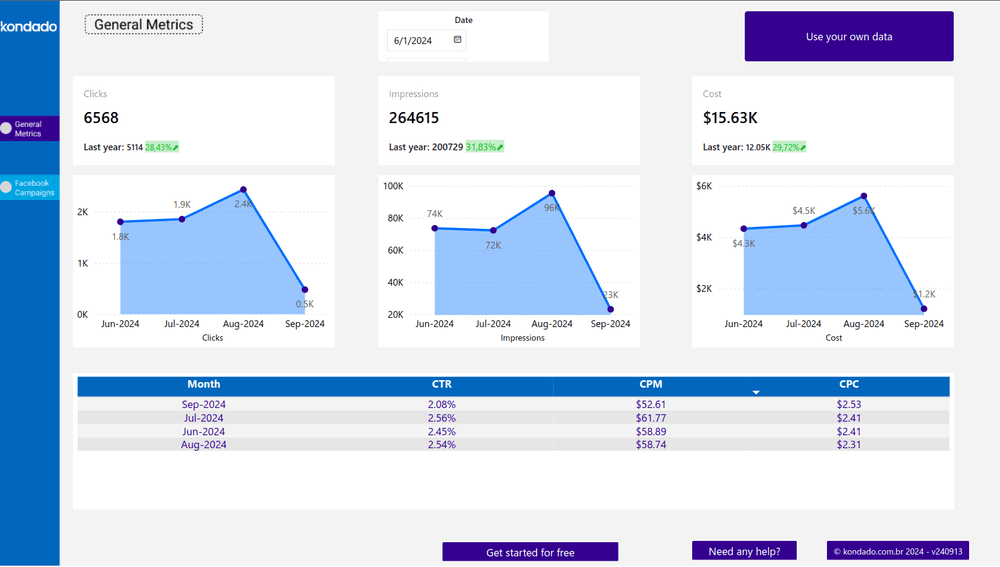
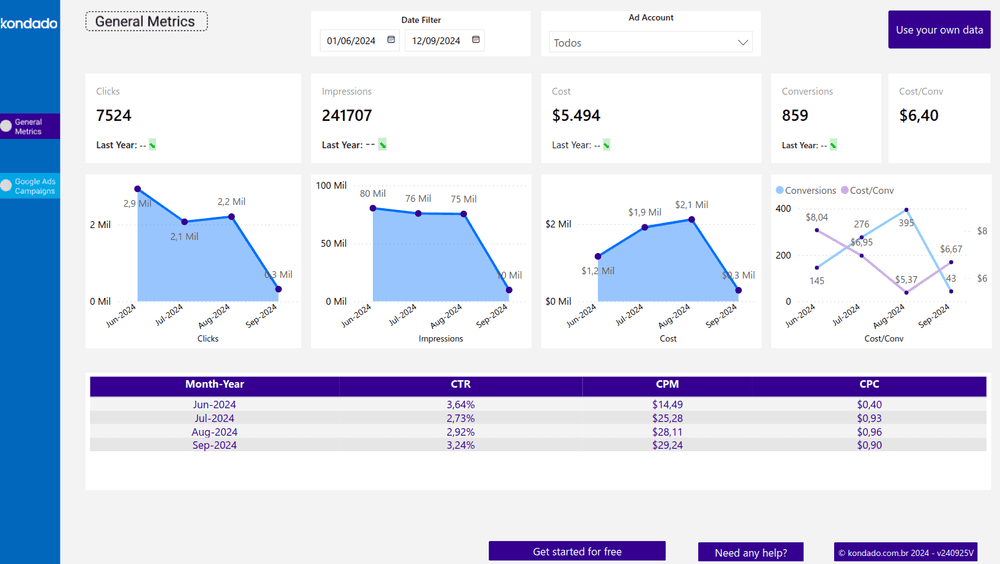
Google Ads
Turn Your Data into Strategic Decisions with Kondado
Create Power BI reports with Kondado and enjoy the benefits of fast data pipeline, customized visualizations, and strategic insights at your fingertips.
Conclusion
Creating reports in Power BI allows you to turn data into strategic actions. The flexibility of the tool, combined with Kondado’s ability to integrate multiple data sources, makes the process even simpler and more efficient.
How to create a Power BI report with Kondado
Step-by-step guide to build a Power BI report using data replicated by Kondado.
Add your data source in Kondado
On the Kondado platform, select your data source and follow the instructions to add it; save and wait for the connection test to pass.
Choose how to build the report
Pick a ready-made report template for a fast start, or create your own report from scratch.
Connect to Power BI
Click 'More options' and choose 'Connect to Power BI, Looker Studio, or a similar tool', then follow the steps to create your pipeline.
Generate the connection link
Once the pipeline is saved and executed, select 'Connect to Power BI' to get the link to paste into Power BI.
Build the report in Power BI
Insert the link in Power BI (see 'See instructions'), load the tables, and build your visualizations.