📹 Google Ads and Facebook Ads Looker Studio
Watch the video below to learn more about this dashboard:
How to Use Your Data in the Kondado Dashboard Template
Accessing Kondado
- The first step to using your own data in the Google Ads and Facebook Ads dashboard on Looker Studio is to create a free trial account at Kondado. To do this, simply visit https://app.kondado.com.br/signup and register with your email.
Connecting Your Data to the Google Ads and Facebook Ads Template in Looker Studio
- Once your Kondado account is created, just follow the first steps tutorial and add a data source for either Google Ads or Facebook Ads.
- When your first data source for Google Ads or Facebook Ads has been created, you will be presented with the option to follow the tutorial to create your dashboard.
- After choosing this option, the platform will create the pipelines and at the end of all the steps, it will present the link to access the dashboard with your own data!
Pipelines and Models
Listed below are the pipelines and models required to use the Report template. Incremental integrations can have the savepoint changed to fetch historical data.
Pipelines:
- Campaign performance (incremental)
- Custom report (incremental)
Dashboard Features
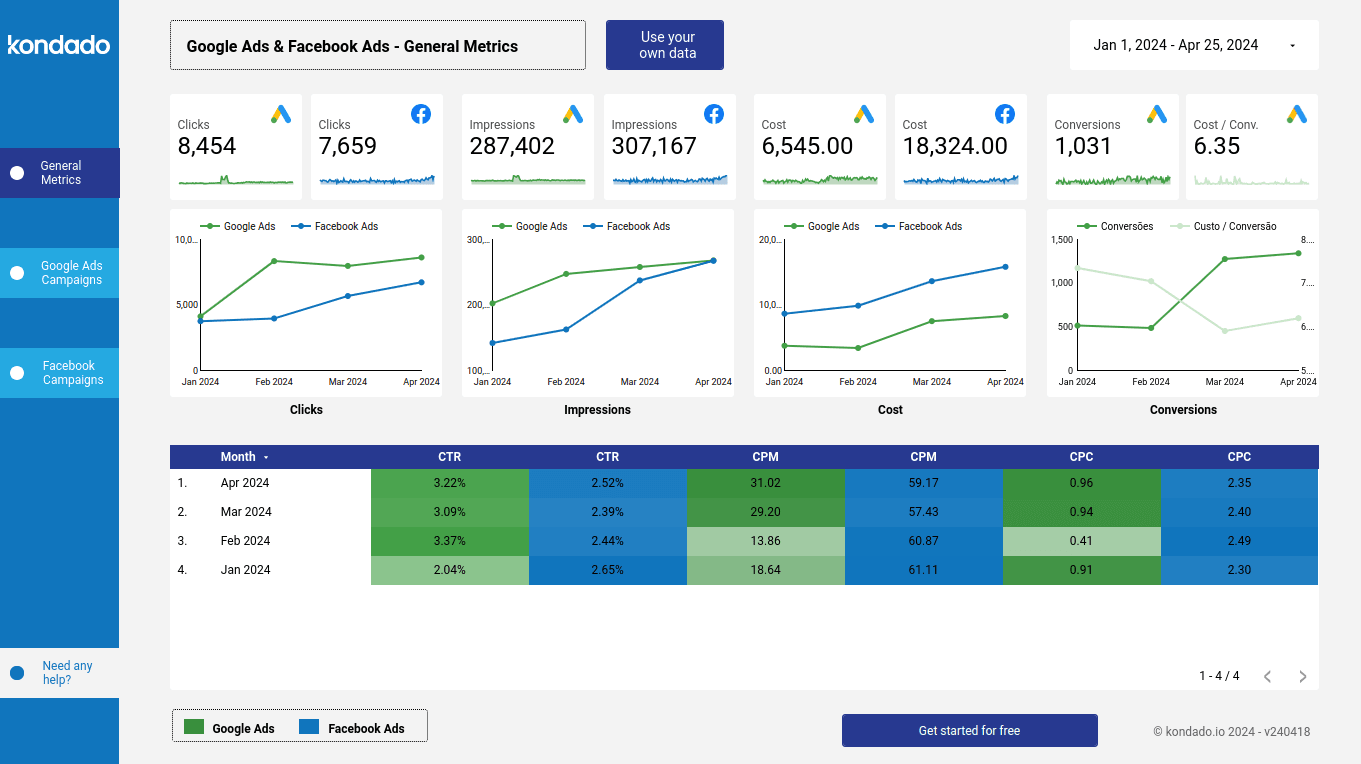
General Metrics Page
This page provides an overview of the key information from Google Ads and Facebook Ads side by side, making it easier to compare metrics such as clicks, cost, impressions, CTR, and others.
Components of the Page
Filters
| Filter | Description | Source Tables | Source Columns |
|---|---|---|---|
| Date | Date selection according to "Date Filter Reference" for each chart | googleads_custom_report, facebook_campaign_insights | According to "Date Filter Reference" for each chart |
Charts
| Chart | Type | Description | Date Filter Reference | Source Tables | Source Columns |
|---|---|---|---|---|---|
| Clicks | Overview with mini-chart | Sum of the number of clicks all campaigns have received during the selected period in the date filter | Metric date | googleads_custom_report, facebook_campaign_insights | googleads_custom_report: segments_date, metrics_clicks; facebook_campaign_insights: metric_date, clicks |
| Impressions | Overview with mini-chart | Sum of the number of impressions all campaigns have received during the selected period in the date filter | Metric date | googleads_custom_report, facebook_campaign_insights | googleads_custom_report: segments_date, metrics_impressions; facebook_campaign_insights: metric_date, impressions |
| Cost | Overview with mini-chart | Sum of the total cost of all campaigns during the selected period in the date filter | Metric date | googleads_custom_report, facebook_campaign_insights | googleads_custom_report: segments_date, metrics_cost; facebook_campaign_insights: metric_date, spend |
| Conversions | Overview with mini-chart | Sum of the total number of conversions campaigns have achieved during the selected period in the date filter | Metric date | googleads_custom_report | googleads_custom_report: segments_date, metrics_conversions |
| Cost/Conv. | Overview with mini-chart | Division of the total cost by the total number of conversions of the campaigns during the selected period in the date filter | Metric date | googleads_custom_report | googleads_custom_report: segments_date, metrics_conversions, metrics_cost |
Recommended: For the Ad Account filter to work properly, the Descriptive Name field must be filled in the Google Ads configuration:
- Go to Google Ads → Settings → Account preferences
- Fill in the Descriptive name field
- Save
- Run the integration again
After filling, subsequent syncs will bring the value.
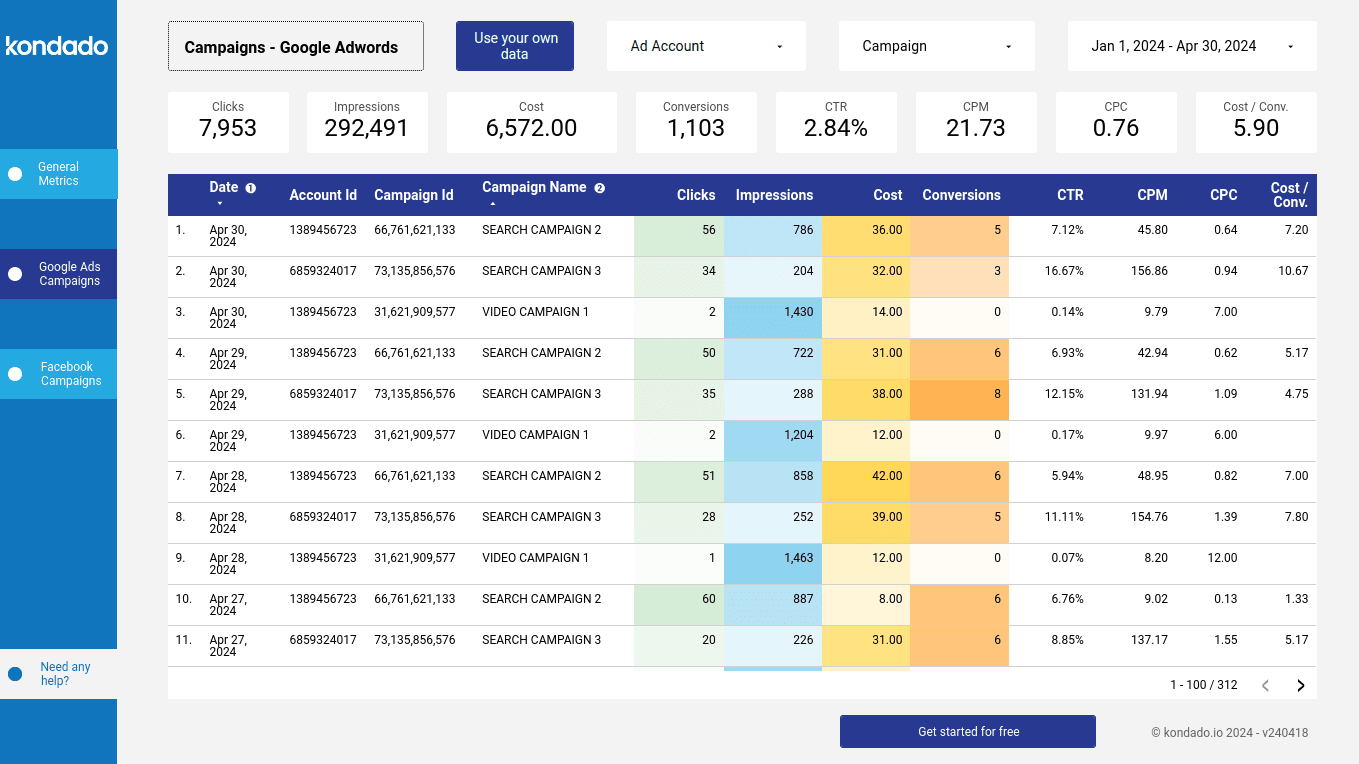
Google Ads Campaigns Page
This page provides a detailed view of the key metrics related to Google Ads campaigns, broken down by day.
Components of the Page
Filters
| Filter | Description | Source Tables | Source Columns |
|---|---|---|---|
| Ad Account | Selection of ad account ID | googleads_custom_report | _kdd_account_id |
| Campaign | Selection of campaign name | googleads_custom_report | campaign_name |
| Date | Date selection according to "Date Filter Reference" for each chart | googleads_custom_report | According to "Date Filter Reference" for each chart |
Charts
| Chart | Type | Description | Date Filter Reference | Source Tables | Source Columns |
|---|---|---|---|---|---|
| Clicks | Overview | Sum of the number of clicks all campaigns received in the selected period | Metric Date | googleads_custom_report | segments_date, metrics_clicks |
| Impressions | Overview | Sum of the number of impressions all campaigns received in the selected period | Metric Date | googleads_custom_report | segments_date, metrics_impressions |
| Cost | Overview | Sum of the total cost of all campaigns in the selected period | Metric Date | googleads_custom_report | segments_date, metrics_cost |
| CTR (Click-Through Rate) | Overview | Division of the total sum of clicks by the total sum of impressions, resulting in a percentage for the selected period | Metric Date | googleads_custom_report | segments_date, metrics_impressions, metrics_clicks |
| CPM (Cost Per Mille) | Overview | Total cost sum divided by the total sum of impressions divided by a thousand (cost per thousand impressions) for the selected period | Metric Date | googleads_custom_report | segments_date, metrics_impressions, metrics_cost |
| CPC (Cost Per Click) | Overview | Total cost sum divided by the total sum of clicks (cost per click) for the selected period | Metric Date | googleads_custom_report | segments_date, metrics_clicks, metrics_cost |
| Cost/Conversion | Overview | Division of total cost by the total number of conversions of the campaigns in the selected period | Metric Date | googleads_custom_report | segments_date, metrics_conversions, metrics_cost |
| Campaign List | Table | - Date: metric date - Ad Account ID: ID of the ad account to which the campaign belongs - Campaign ID: campaign ID - Campaign Name: campaign name - Clicks: sum of clicks on the date for the specified campaign, according to selected filters - Impressions: sum of impressions on the date for the specified campaign, according to selected filters - Cost: sum of the total cost of the specified campaign on the date, according to selected filters - Conversions: sum of conversions of the specified campaign on the date, according to selected filters - CTR (Click-Through Rate): division of the total sum of clicks by the total sum of impressions of the specified campaign on the date, according to selected filters - CPM (Cost Per Mille): total cost divided by the total sum of impressions divided by a thousand (cost per thousand impressions) of the specified campaign on the date, according to selected filters - CPC (Cost Per Click): total cost divided by the total sum of clicks (cost per click) of the specified campaign on the date, according to selected filters - Cost/Conversion: division of the total cost by the total number of conversions of the specified campaign on the date, as well as the division of total cost by the total number of conversions of campaigns | Metric Date | googleads_custom_report | segments_date, metrics_cost, metrics_impressions, metrics_clicks, metrics_conversions |
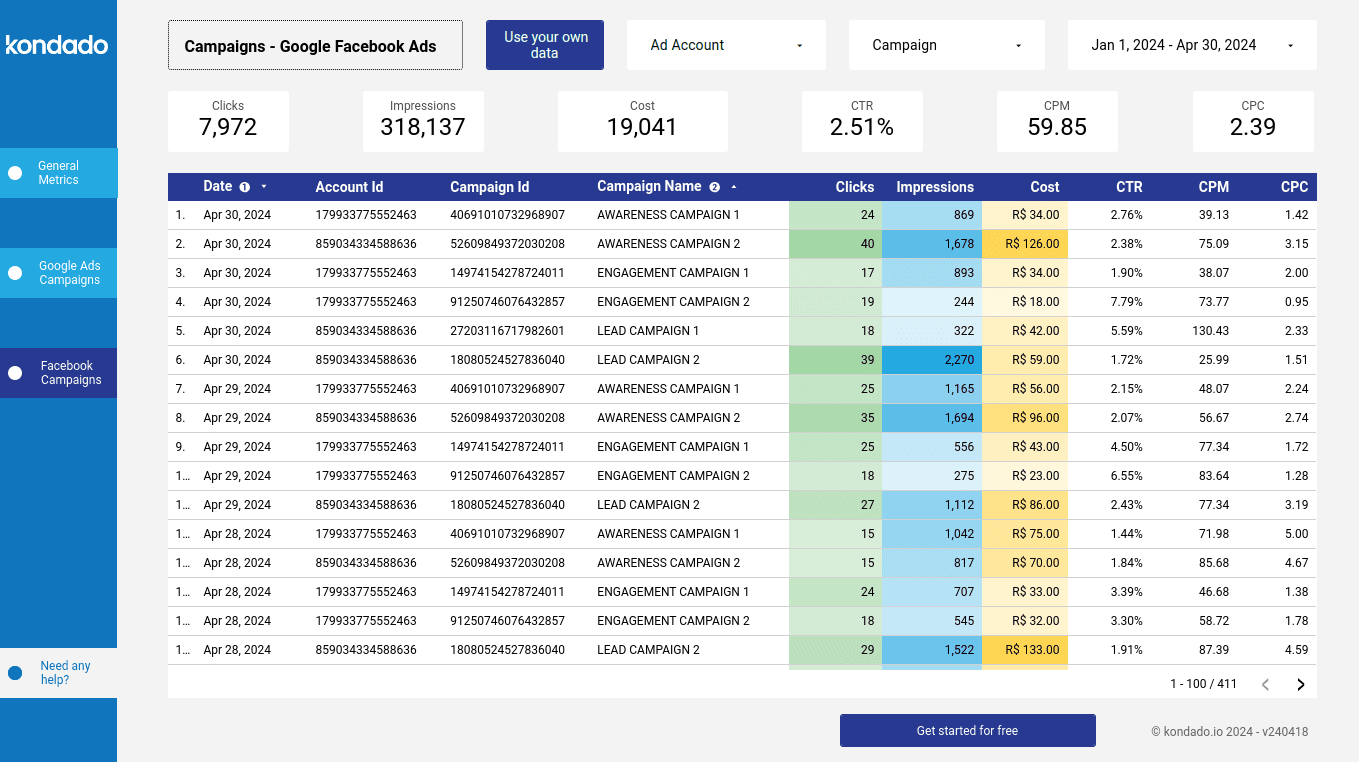
Facebook Campaigns Page
This page provides a detailed view of the key metrics related to Facebook Ads campaigns, broken down by day.
Components of the Page
Filters
| Filter | Description | Source Tables | Source Columns |
|---|---|---|---|
| Ad Account | Selection of ad account ID | facebook_campaign_insights | account_id |
| Campaign | Selection of campaign name | facebook_campaign_insights | campaign_name |
| Date | Date selection according to "Date Filter Reference" for each chart | facebook_campaign_insights | According to "Date Filter Reference" for each chart |
Charts
| Chart | Type | Description | Date Filter Reference | Source Tables | Source Columns |
|---|---|---|---|---|---|
| Clicks | Overview | Sum of the number of clicks all campaigns obtained during the selected period in the date filter | Metric date | facebook_campaign_insights | metric_date, clicks |
| Impressions | Overview | Sum of the number of impressions all campaigns obtained during the selected period in the date filter | Metric date | facebook_campaign_insights | metric_date, impressions |
| Cost | Overview | Sum of the total cost of all campaigns during the selected period in the date filter | Metric date | facebook_campaign_insights | metric_date, spend |
| CTR (Click-Through Rate) | Overview | Division of the total number of clicks by the total number of impressions, resulting in a percentage for the selected period | Metric date | facebook_campaign_insights | metric_date, impressions, clicks |
| CPM (Cost Per Mille) | Overview | Total cost divided by the total number of impressions divided by a thousand (cost per thousand impressions) for the selected period | Metric date | facebook_campaign_insights | metric_date, impressions, spend |
| CPC (Cost Per Click) | Overview | Total cost divided by the total number of clicks (cost per click) for the selected period | Metric date | facebook_campaign_insights | metric_date, spend, clicks |
| Campaign List | Table | - Date: metric date - Ad Account ID: ID of the ad account to which the campaign belongs - Campaign ID: campaign ID - Campaign Name: campaign name - Clicks: sum of clicks on the date for the specified campaign, according to selected filters - Impressions: sum of impressions on the date for the specified campaign, according to selected filters - Cost: sum of the total cost of the specified campaign on the date, according to selected filters - CTR (Click-Through Rate): division of the total sum of clicks by the total sum of impressions of the specified campaign on the date, according to selected filters - CPM (Cost Per Mille): total cost divided by the total sum of impressions divided by a thousand (cost per thousand impressions) of the specified campaign on the date, according to selected filters - CPC (Cost Per Click): total cost divided by the total sum of clicks (cost per click) of the specified campaign on the date, according to selected filters | Metric Date | facebook_campaign_insights | metric_date spend impressions clicks |
Use the Google Ads and Facebook Ads Looker Studio Template
Set up your Kondado account, connect ad data sources, and launch a pre-built Looker Studio dashboard to compare Google Ads and Facebook Ads performance side by side.
Create a free Kondado trial account
Visit the Kondado signup page and register with your email to get started. This is the first step to using your own data in the dashboard template.
Connect Google Ads or Facebook Ads as a data source
After logging in, follow the first steps tutorial and add a data source for either Google Ads or Facebook Ads. Kondado will guide you through the data integration process to establish your pipeline.
Follow the dashboard creation tutorial
Once your first ad data source is created, choose the option to follow the tutorial for creating your dashboard. The platform will automatically build the required pipelines and models, including Campaign performance and Custom report incremental integrations.
Configure Google Ads Descriptive Name for filtering
For the Ad Account filter to work properly, go to Google Ads → Settings → Account preferences, fill in the Descriptive name field, save, and run the integration again. Subsequent syncs will bring this value into your reports.
Access your live Looker Studio dashboard
At the end of the setup steps, Kondado will present the link to access your dashboard with your own data. You can then explore the General Metrics page for side-by-side comparison, or dive into the Google Ads Campaigns and Facebook Campaigns pages for detailed daily breakdowns.