📹 Google Ads Power BI
Watch the video below to learn more about this dashboard:
Pipelines and Models
Listed below are the pipelines and models required to use the Report template. Incremental integrations can have the savepoint changed to fetch historical data.
Pipelines:
- Custom report (incremental)
Dashboard Features
General Metrics Page
This page provides an overview of the key information from Google Ads, making it easier to understand metrics such as clicks, cost, impressions, CTR, and others.
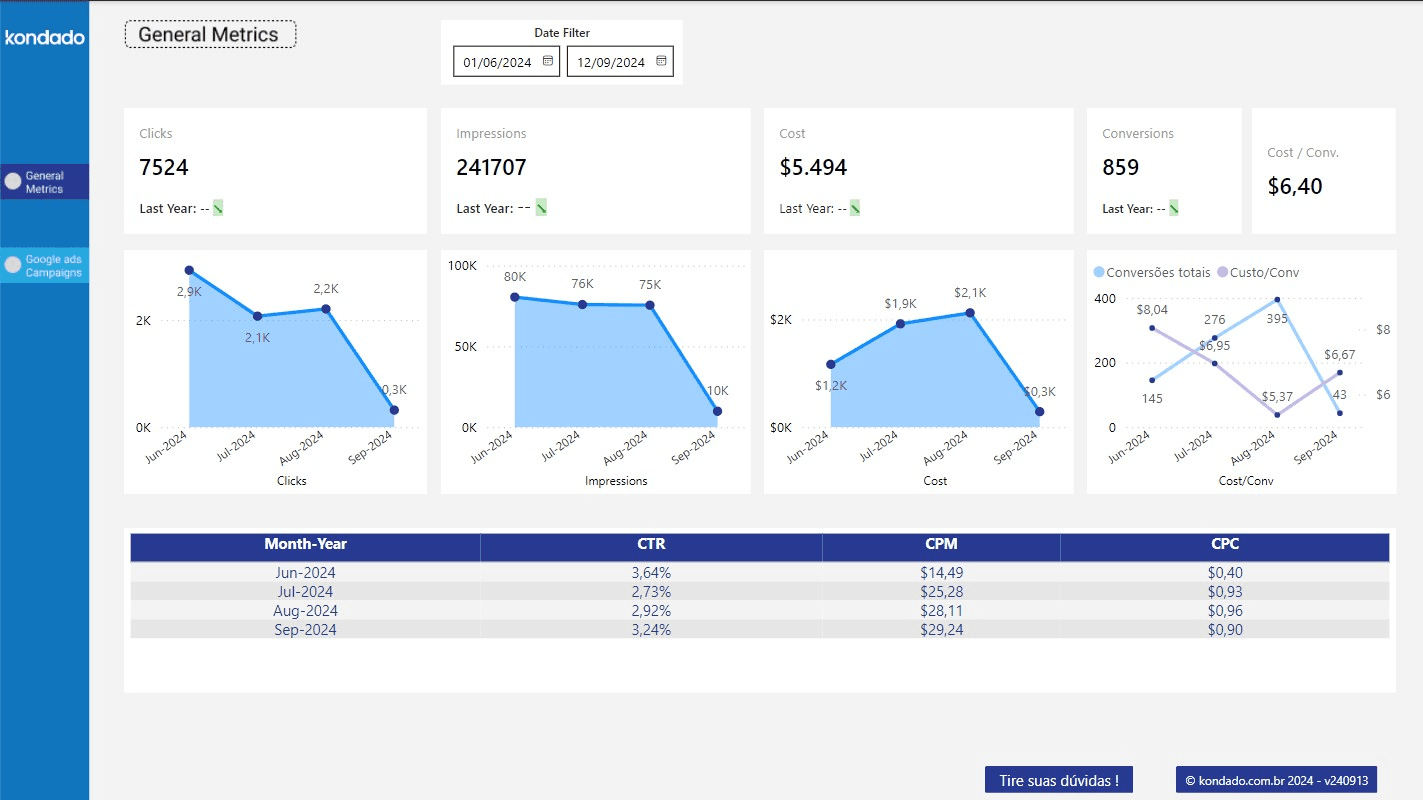
Components of the Page
Filters
| Filter | Description | Source Tables | Source Columns |
|---|---|---|---|
| Date | Date selection according to "Date Filter Reference" for each chart | googleads_custom_report, | According to "Date Filter Reference" for each chart |
Charts
| Chart | Type | Description | Date Filter Reference | Source Tables | Source Columns |
|---|---|---|---|---|---|
| Clicks | Overview with mini-chart | Sum of the number of clicks all campaigns have received during the selected period in the date filter | Metric date | googleads_custom_report, | googleads_custom_report: segments_date, metrics_clicks; |
| Impressions | Overview with mini-chart | Sum of the number of impressions all campaigns have received during the selected period in the date filter | Metric date | googleads_custom_report, | googleads_custom_report: segments_date, metrics_impressions; |
| Cost | Overview with mini-chart | Sum of the total cost of all campaigns during the selected period in the date filter | Metric date | googleads_custom_report, | googleads_custom_report: segments_date, metrics_cost; facebook_campaign_insights: metric_date, spend |
| Conversions | Overview with mini-chart | Sum of the total number of conversions campaigns have achieved during the selected period in the date filter | Metric date | googleads_custom_report | googleads_custom_report: segments_date, metrics_conversions |
| Cost/Conv. | Overview with mini-chart | Division of the total cost by the total number of conversions of the campaigns during the selected period in the date filter | Metric date | googleads_custom_report | googleads_custom_report: segments_date, metrics_conversions, metrics_cost |
Recommended: For the Ad Account filter to work properly, the Descriptive Name field must be filled in the Google Ads configuration:
- Go to Google Ads → Settings → Account preferences
- Fill in the Descriptive name field
- Save
- Run the integration again
After filling, subsequent syncs will bring the value.
Google Ads Campaigns Page
This page provides a detailed view of the key metrics related to Google Ads campaigns, broken down by day.
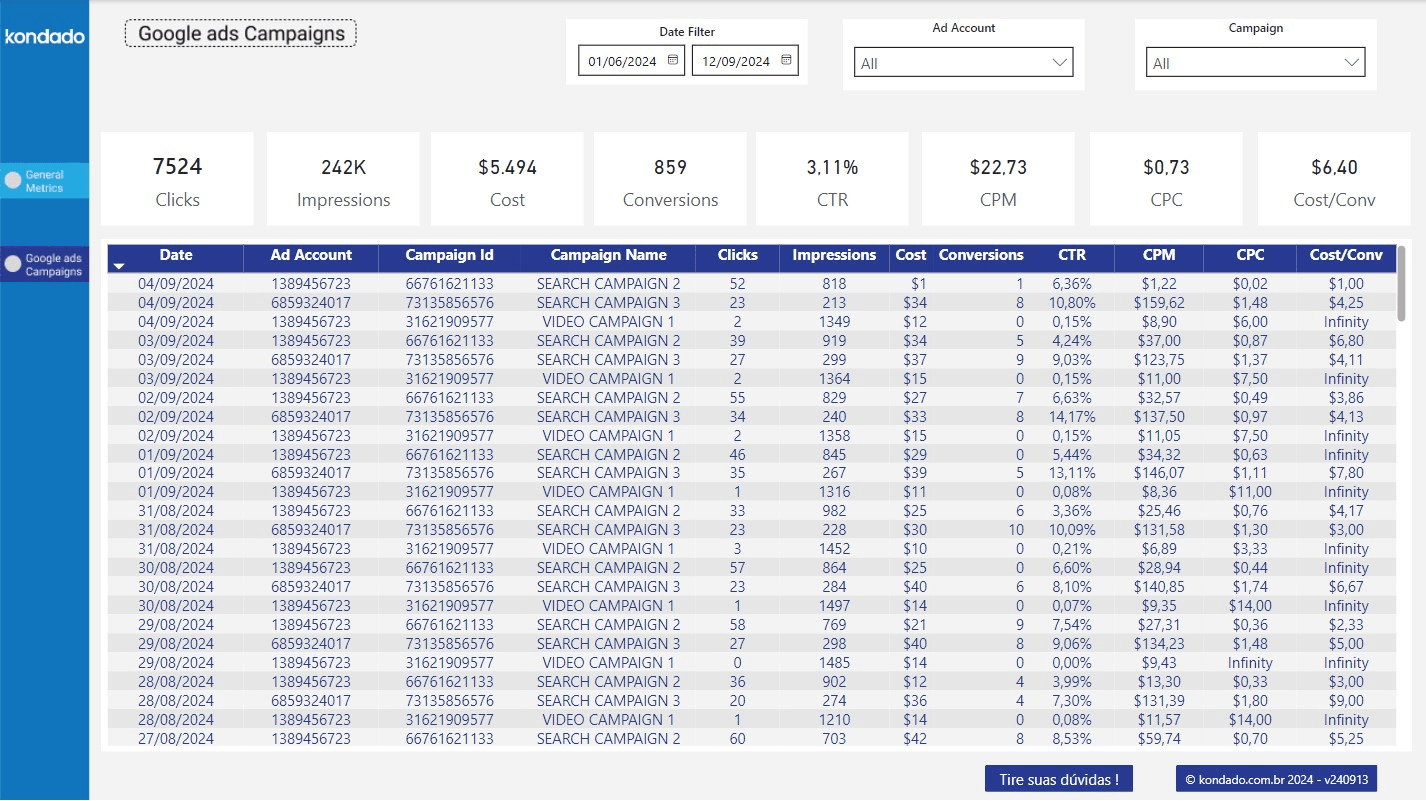
Components of the Page
Filters
| Filter | Description | Source Tables | Source Columns |
|---|---|---|---|
| Ad Account | Selection of ad account ID | googleads_custom_report | _kdd_account_id |
| Campaign | Selection of campaign name | googleads_custom_report | campaign_name |
| Date | Date selection according to "Date Filter Reference" for each chart | googleads_custom_report | According to "Date Filter Reference" for each chart |
Charts
| Chart | Type | Description | Date Filter Reference | Source Tables | Source Columns |
|---|---|---|---|---|---|
| Clicks | Overview | Sum of the number of clicks all campaigns received in the selected period | Metric Date | googleads_custom_report | segments_date, metrics_clicks |
| Impressions | Overview | Sum of the number of impressions all campaigns received in the selected period | Metric Date | googleads_custom_report | segments_date, metrics_impressions |
| Cost | Overview | Sum of the total cost of all campaigns in the selected period | Metric Date | googleads_custom_report | segments_date, metrics_cost |
| CTR (Click-Through Rate) | Overview | Division of the total sum of clicks by the total sum of impressions, resulting in a percentage for the selected period | Metric Date | googleads_custom_report | segments_date, metrics_impressions, metrics_clicks |
| CPM (Cost Per Mille) | Overview | Total cost sum divided by the total sum of impressions divided by a thousand (cost per thousand impressions) for the selected period | Metric Date | googleads_custom_report | segments_date, metrics_impressions, metrics_cost |
| CPC (Cost Per Click) | Overview | Total cost sum divided by the total sum of clicks (cost per click) for the selected period | Metric Date | googleads_custom_report | segments_date, metrics_clicks, metrics_cost |
| Cost/Conversion | Overview | Division of total cost by the total number of conversions of the campaigns in the selected period | Metric Date | googleads_custom_report | segments_date, metrics_conversions, metrics_cost |
| Campaign List | Table | - Date: metric date - Ad Account ID: ID of the ad account to which the campaign belongs - Campaign ID: campaign ID - Campaign Name: campaign name - Clicks: sum of clicks on the date for the specified campaign, according to selected filters - Impressions: sum of impressions on the date for the specified campaign, according to selected filters - Cost: sum of the total cost of the specified campaign on the date, according to selected filters - Conversions: sum of conversions of the specified campaign on the date, according to selected filters - CTR (Click-Through Rate): division of the total sum of clicks by the total sum of impressions of the specified campaign on the date, according to selected filters - CPM (Cost Per Mille): total cost divided by the total sum of impressions divided by a thousand (cost per thousand impressions) of the specified campaign on the date, according to selected filters - CPC (Cost Per Click): total cost divided by the total sum of clicks (cost per click) of the specified campaign on the date, according to selected filters - Cost/Conversion: division of the total cost by the total number of conversions of the specified campaign on the date, as well as the division of total cost by the total number of conversions of campaigns | Metric Date | googleads_custom_report | segments_date, metrics_cost, metrics_impressions, metrics_clicks, metrics_conversions |
Use the Google Ads Report template in Power BI
Follow these steps to set up and use Kondado's Google Ads Report template in Power BI, from data integration to dashboard configuration.
Set up the Google Ads pipeline
Create a data integration using the Google Ads Custom Report (incremental) pipeline. This will sync your campaign data into your destination for use with the Power BI template.
Configure your Google Ads account name
Go to Google Ads → Settings → Account preferences and fill in the Descriptive Name field. Save the changes, then run the integration again so the Ad Account filter in the report works properly.
Connect your data to Power BI
Use the synced googleads_custom_report table as the data source for the Google Ads Power BI template. Ensure your date and metric columns are correctly mapped.
Explore the General Metrics page
Review the overview page showing clicks, impressions, cost, conversions, and cost per conversion. Use the date filter to analyze performance across different time periods.
Analyze campaign-level details
Switch to the Google Ads Campaigns page to filter by ad account and campaign name. Examine daily breakdowns of CTR, CPM, CPC, and cost per conversion in the detailed campaign table.
Frequently asked questions
googleads_custom_report table.