Investing in Facebook Ads is one of the most effective strategies to reach new customers and grow brand awareness. But launching campaigns is just the beginning, to make sure your budget is driving real results, you need to closely monitor performance data and understand how each ad is performing.
Without that visibility, you risk wasting budget, repeating ineffective creatives, or missing opportunities to optimize. That’s why tracking the right metrics and creating consistent reports is critical for any successful digital marketing strategy.
In this article, you'll learn which metrics are essential and explore different ways to build your Facebook Ads reports effectively.
Must-have metrics in your Facebook Ads report
We’ve selected some key metrics to help you better understand how your profile is performing.
1. Clicks
Total number of clicks generated by your ads. It’s one of the most important metrics for measuring engagement and audience interest.
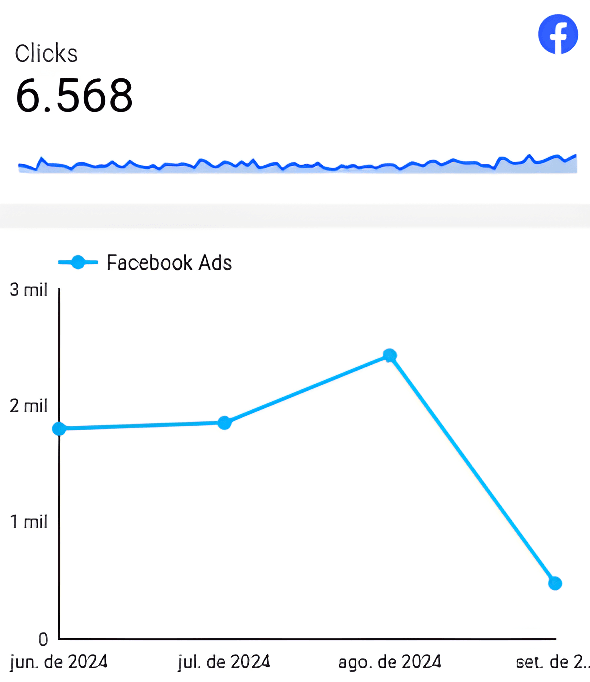
Screenshot of Facebook Ads Looker Studio Report by Kondado
2. Impressions
Total number of impressions generated by the campaigns. It’s useful for understanding the campaign’s reach and evaluating ad frequency.
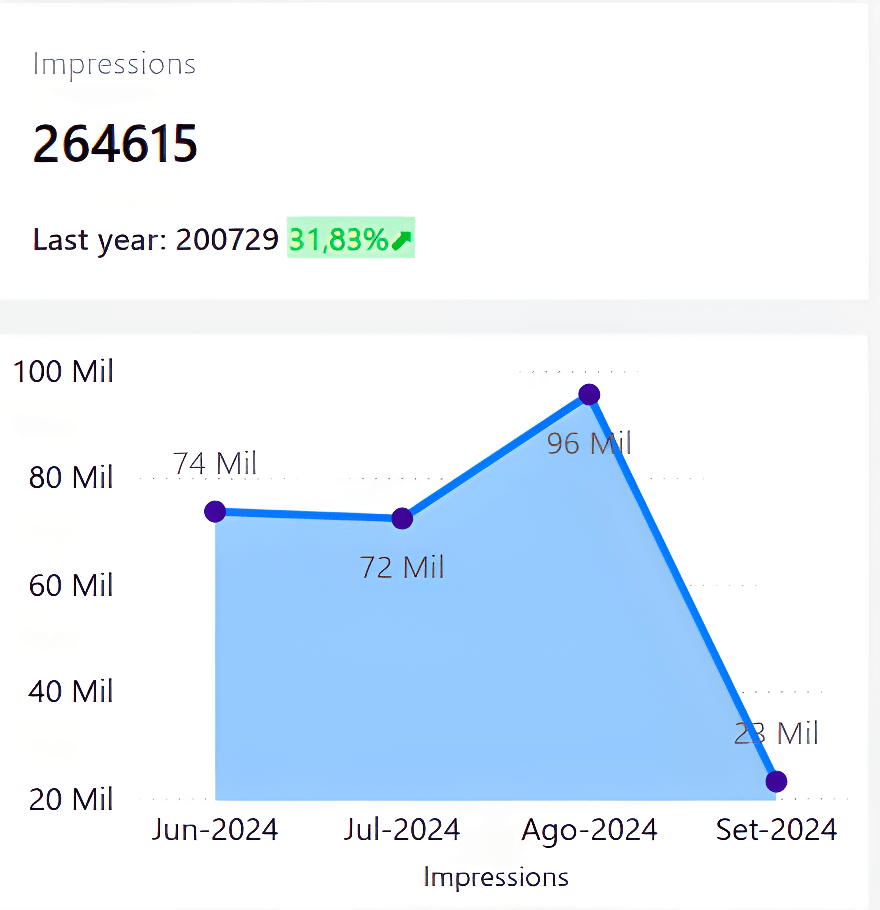
Screenshot of Facebook Ads Power BI Report by Kondado
3. Cost
Total amount invested in the campaigns. This metric helps compare the investment with the results achieved.
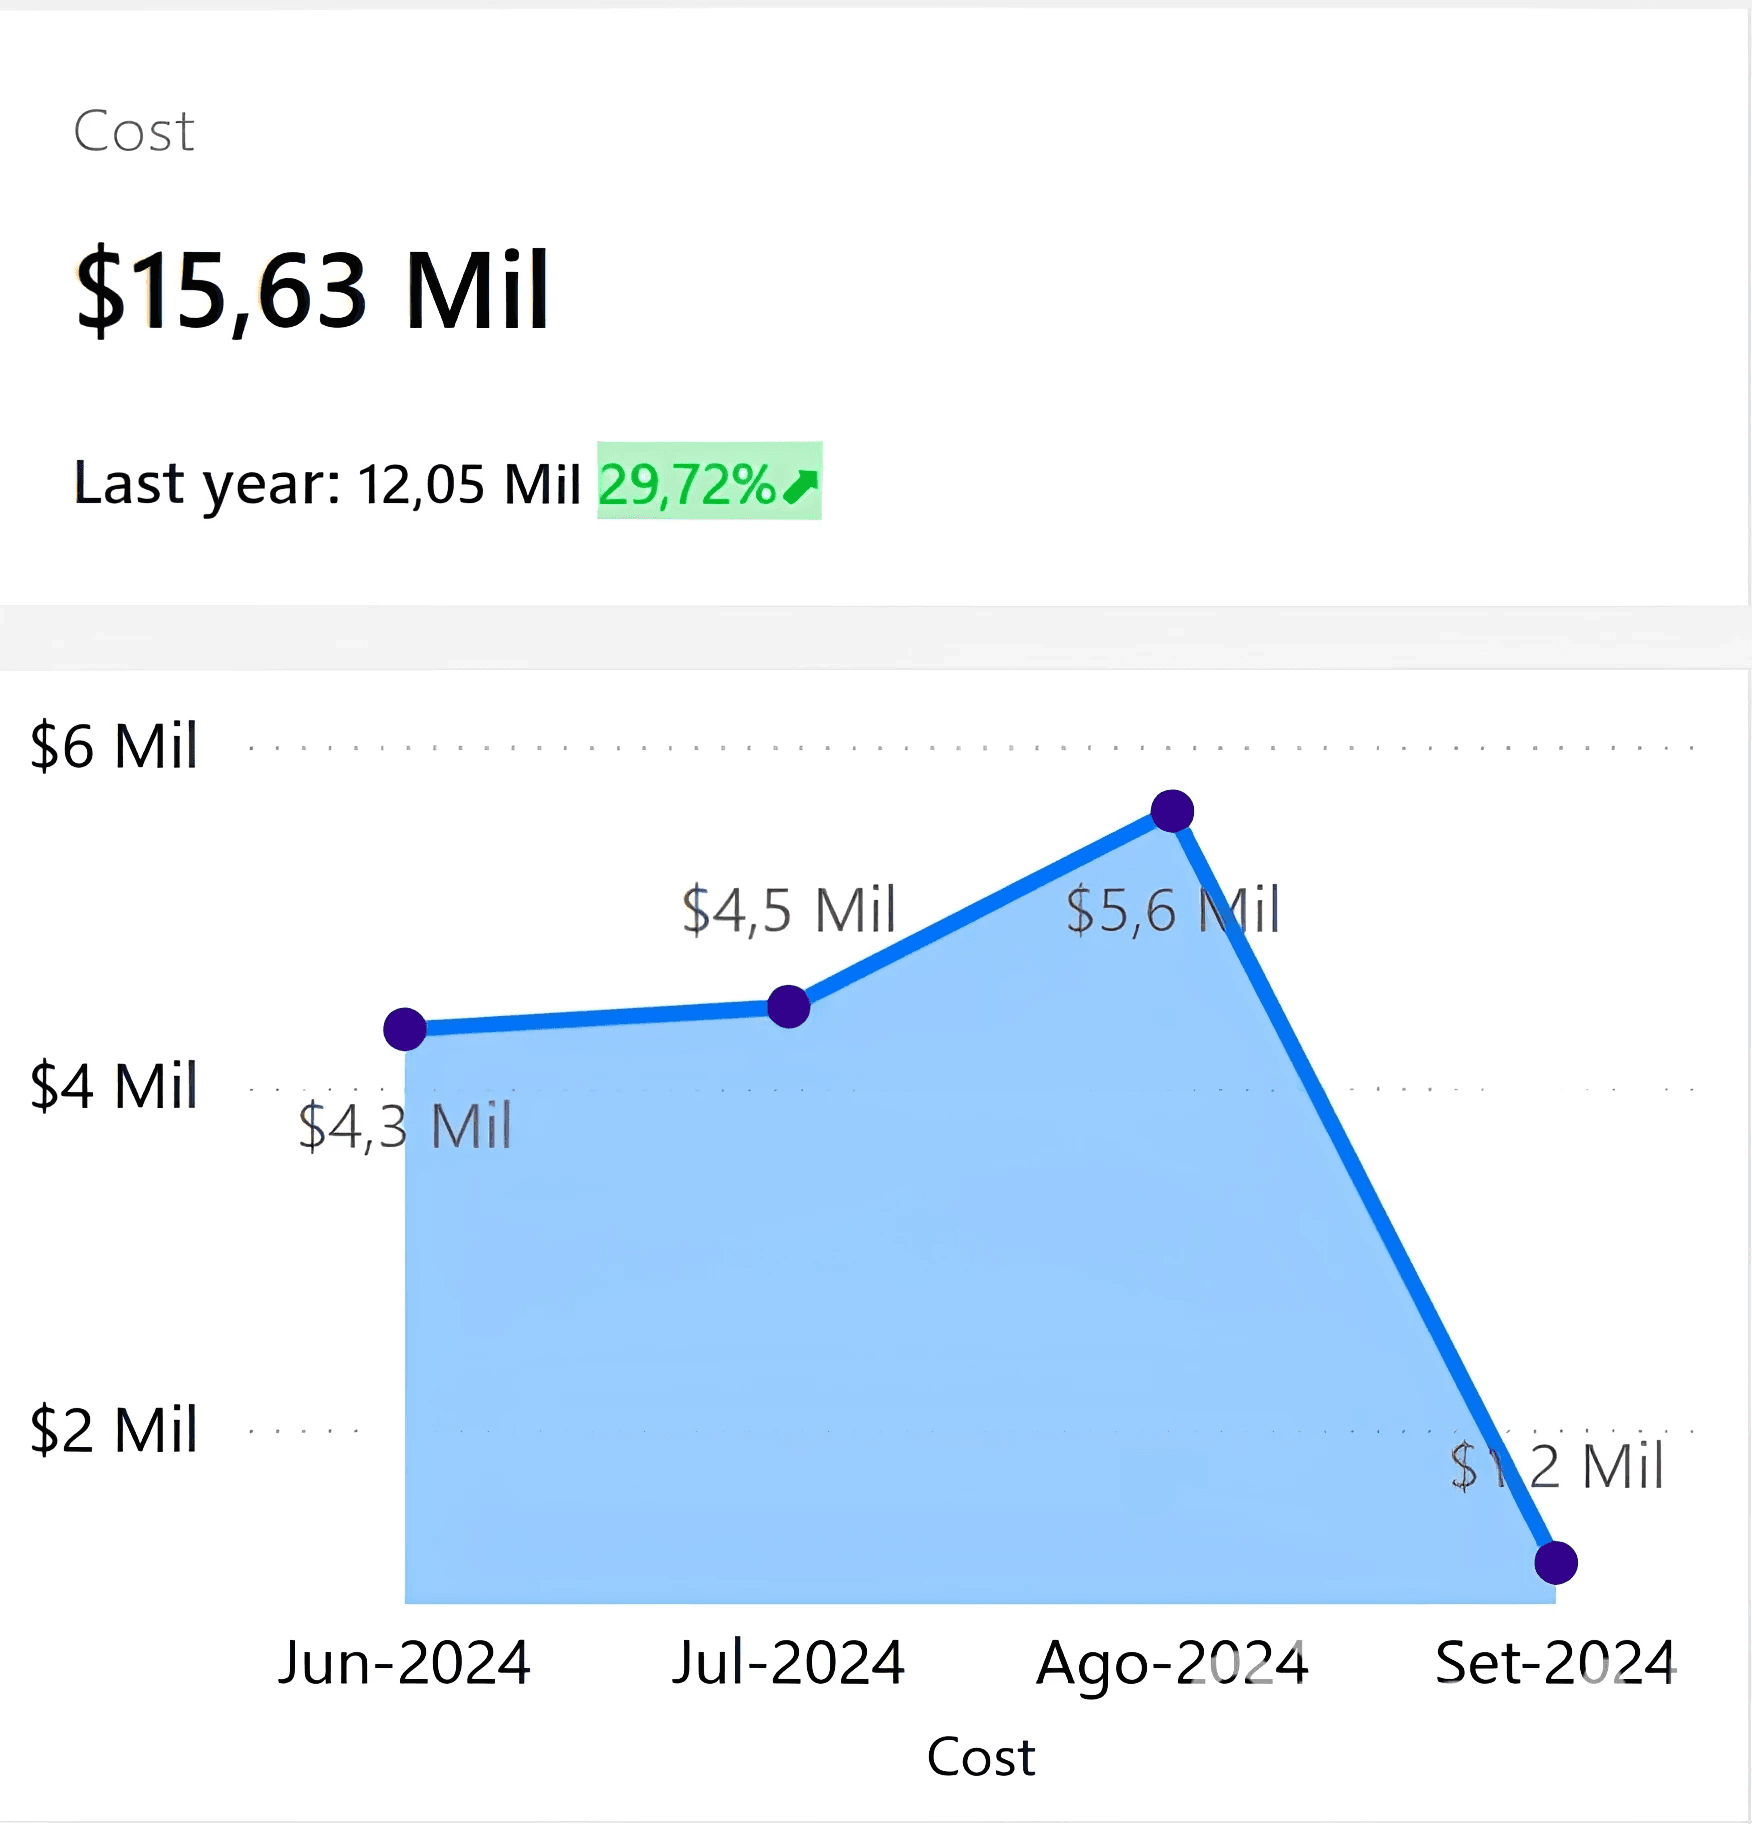
Screenshot of Facebook Ads Power BI Report by Kondado
4. CTR (Click Through Rate)
Calculated by dividing the total number of clicks by the total number of impressions in the campaign.
5. CPM (Cost per Thousand Impressions)
Indicates how much you're paying for every thousand ad impressions. It’s calculated by dividing the total cost by the total number of impressions, then multiplying the result by one thousand.
6. CPC (Cost per Click)
Calculated by dividing the total campaign cost by the number of clicks generated. This metric helps assess the campaign’s efficiency in terms of cost per engagement.
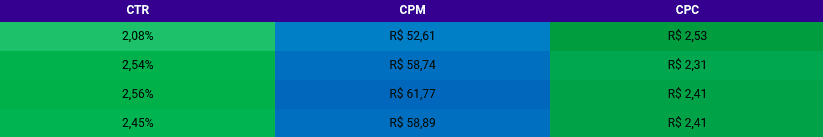
Screenshot of Facebook Ads Looker Studio Report by Kondado
7. Metric Date (by day, week, month, or year)
Allows you to analyze data trends over time and identify seasonality, patterns, and peak performance periods.
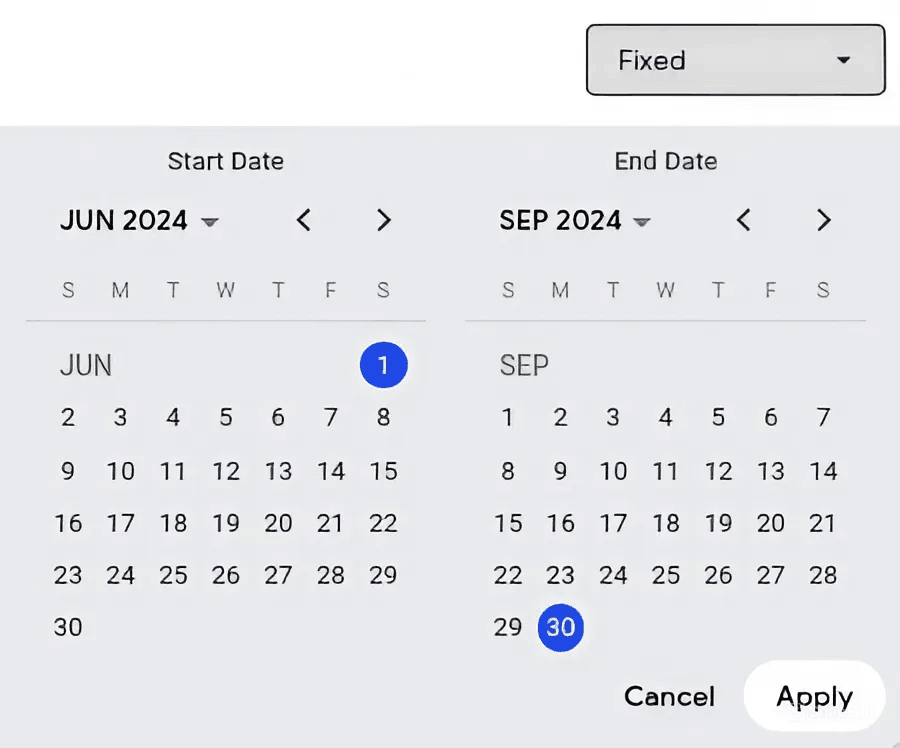
Screenshot of Facebook Ads Looker Studio Report by Kondado
How to Build Your Facebook Ads Report
You can build your report in three different ways:
1. Manual Method
You can access Facebook Ads Manager, export the data in CSV format, and build your charts and tables in Excel or Google Sheets. It’s a viable option, but it can be time-consuming and prone to human error.
2. Using Kondado
Kondado lets you automate your Facebook Ads report by connecting your account and sending the data to:
- Spreadsheets in Excel or Google Sheets
- BI tools like Looker Studio and Power BI
- Databases such as BigQuery and PostgreSQL
This way, you can build custom reports with automatic updates and interactive visualizations, all without writing a single line of code.
3. Using Kondado’s ready-made templates
Looking for a faster option? Kondado offers report templates with all the key metrics already set up. Just connect your data and get a complete report in minutes.
Change the way you analyze your campaigns
Conclusion
Tracking Facebook Ads metrics is essential to understand the effectiveness of your campaigns and make smarter decisions. By focusing on the right metrics and choosing the most efficient way to build your reports, you save time, gain clarity, and take full control of your advertising investments.
Build a Facebook Ads Report
Define the right Facebook Ads metrics and assemble them in a spreadsheet or BI tool, with Kondado handling the data pipeline.
Define the metrics that matter
Pick the core metrics for your report: Clicks, Impressions, Cost, CTR, CPM, CPC, and Metric Date. These cover engagement, reach, investment, and trends over time.
Choose how to source the data
Decide between manual CSV exports from Facebook Ads Manager or automated pipelines via Kondado, which loads Facebook Ads data into spreadsheets, BI tools, or databases on a schedule you choose.
Pick a destination for your report
Send the data to Excel or Google Sheets for spreadsheet analysis, to Power BI or Looker Studio for dashboards, or to BigQuery / PostgreSQL for deeper modelling.
Assemble the visuals
Build scorecards for the headline metrics, time-series charts for trends, and breakdown tables by campaign and ad set. Add filters by date, campaign, and creative.
Use a ready-made template to skip setup
If you want to skip the build, start from one of Kondado's Facebook Ads report templates for Power BI or Looker Studio and connect your account.