
Google Ads is one of the most powerful tools for generating qualified traffic and increasing business conversions. To ensure that your investment is delivering real results, it is crucial to monitor the data continuously and in a structured way.
In this article, you will learn about the main metrics that are essential for your Google Ads report and discover practical ways to create it effectively.
Essential metrics for your Google Ads report
We have selected some of the main metrics that provide a complete view of your campaign's performance in Google Ads:
1. Clicks
Indicates the total number of clicks in the campaigns during the selected period.
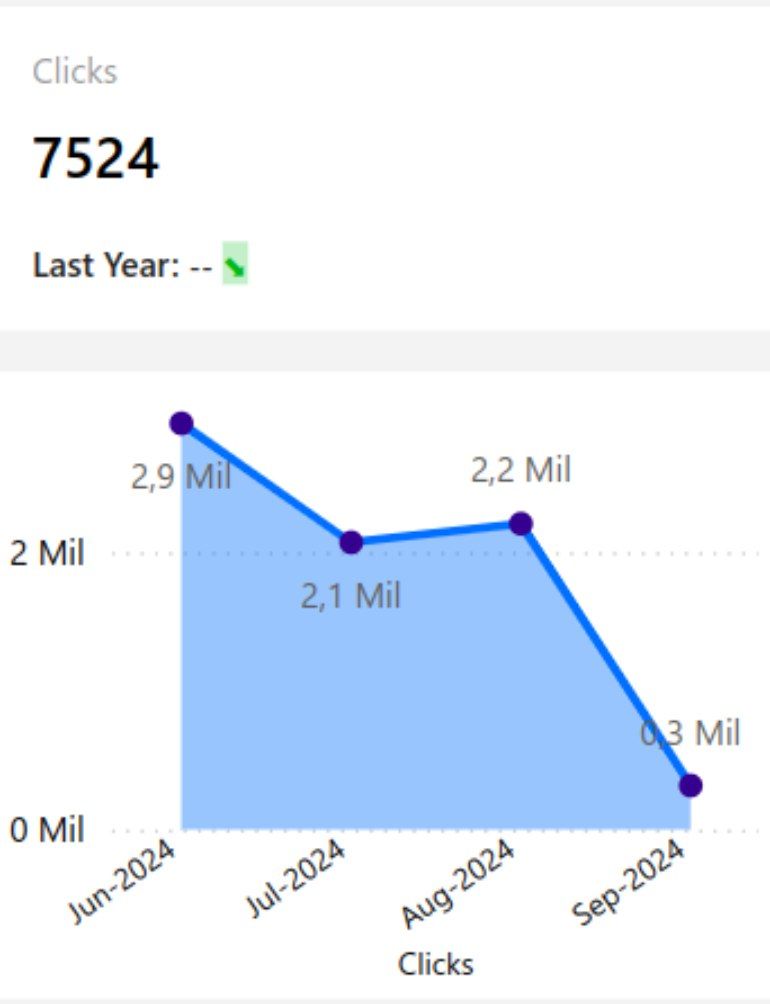
Screenshot of Google Ads Power BI Report by Kondado
2. Impressions
Shows how many times your ad was displayed.
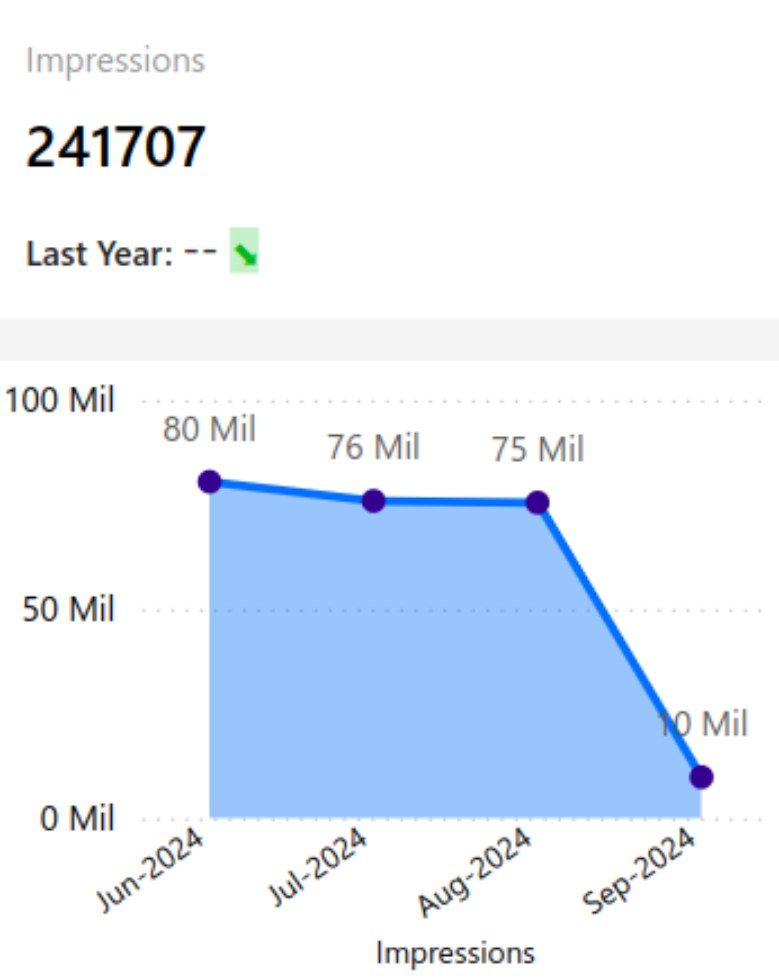
Screenshot of Google Ads Power BI Report by Kondado
3. Cost
The total amount invested in the campaigns over a specific period.
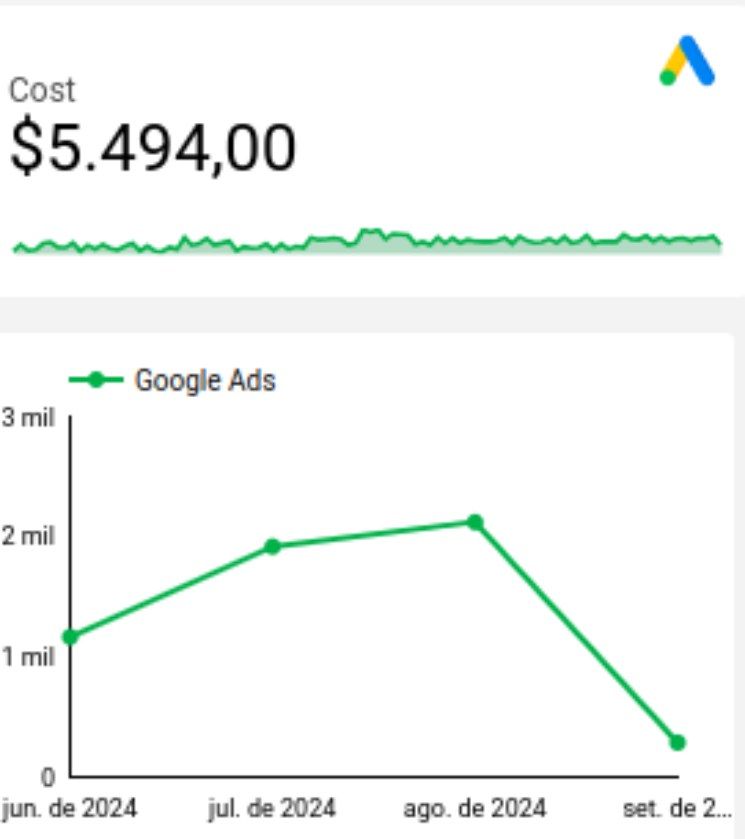
Screenshot of Google Ads Looker Studio Report by Kondado
4. Conversions
These are actions completed by customers/users, such as purchases, downloads, sign-ups, subscriptions, among others.
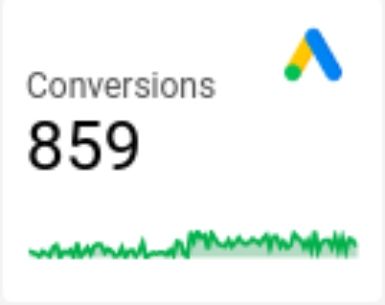
Screenshot of Google Ads Looker Studio Report by Kondado
5. CTR (Click Through Rate)
It is a metric that indicates the ratio of clicks on a link, ad, or email compared to the number of times it was displayed to the audience.
6. CPM (Cost per Thousand Impressions)
The amount paid for every thousand times the ad is displayed.
7. CPC (Cost per Click)
The average cost per click on your ad.
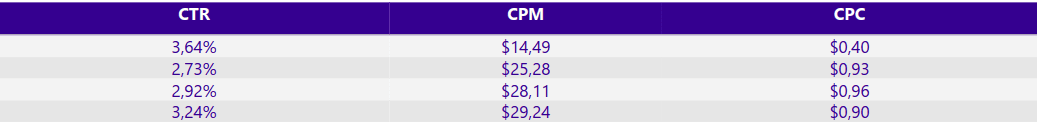
Screenshot of Google Ads Power BI Report by Kondado
Ways to create your Google Ads report
You can create your report in the following different ways:
1. Manually
You can export data from Google Ads and manually organize it into spreadsheets or presentations. This option works well for specific reports, allowing you to customize the information, but it takes more time, is prone to manual errors, and is less practical for frequent updates.
2. Using Kondado
- Spreadsheets in Google Sheets or Excel
- BI platforms like Looker Studio or Power BI
- Databases like Amazon S3 or Redshift
This way, you can create custom reports with automatic updates and interactive charts, all without the need for programming.
3. Using Kondado's ready-made templates
Kondado also offers ready-made and customizable Google Ads report templates, featuring the main metrics already configured and optimized visualizations. Just connect your account, and that's it: your report is ready in just a few minutes, hassle-free.
Change the way you track your campaigns
Closely tracking Google Ads metrics is essential for making strategic decisions and getting the most out of your campaigns. With Kondado, you automate the process, eliminate repetitive tasks, and focus on what truly matters: analyzing results and optimizing your investment.
Create a Google Ads report with essential metrics
Build a structured Google Ads report by selecting the right metrics and using Kondado to automate updates and visualizations.
Define the essential metrics for your report
Pick metrics like Clicks, Impressions, Cost, Conversions, CTR, CPM, and CPC to get a complete view of your Google Ads campaign performance.
Choose how you will build the report
Decide between manually exporting data into spreadsheets or automating the process. Manual reporting allows customization but takes more time and is prone to errors.
Automate replication with Kondado
Connect your Google Ads account to Kondado and replicate the data to spreadsheets, BI tools like Looker Studio or Power BI, or databases like Amazon S3 or Redshift.
Use ready-made report templates
Speed up your reporting with Kondado's ready-made Google Ads templates for Looker Studio and Power BI, with key metrics already configured.
Analyze and optimize your campaigns
With an automated, up-to-date report, focus on analyzing results and making strategic decisions to improve return on ad spend.