Understanding which content resonates with your audience and tracking your Instagram growth is the foundation of a sharper strategy. With Kondado's Instagram report template in Looker Studio you visualize the metrics that matter - followers, reach, engagement, and performance per format - and the report refreshes at the frequency you choose. The Instagram Business data source is set up in minutes, and the same data also answers questions in ChatGPT and Claude through Kondado's MCP server (endpoint https://mcp.kondado.io/mcp).
Step-by-step guide to get started:
2️ - Select your report: Choose the ideal template, and within minutes, Kondado will process your data, generating a structured link where you can access all your Instagram insights.
Report Features
Our report is divided into two main sections:
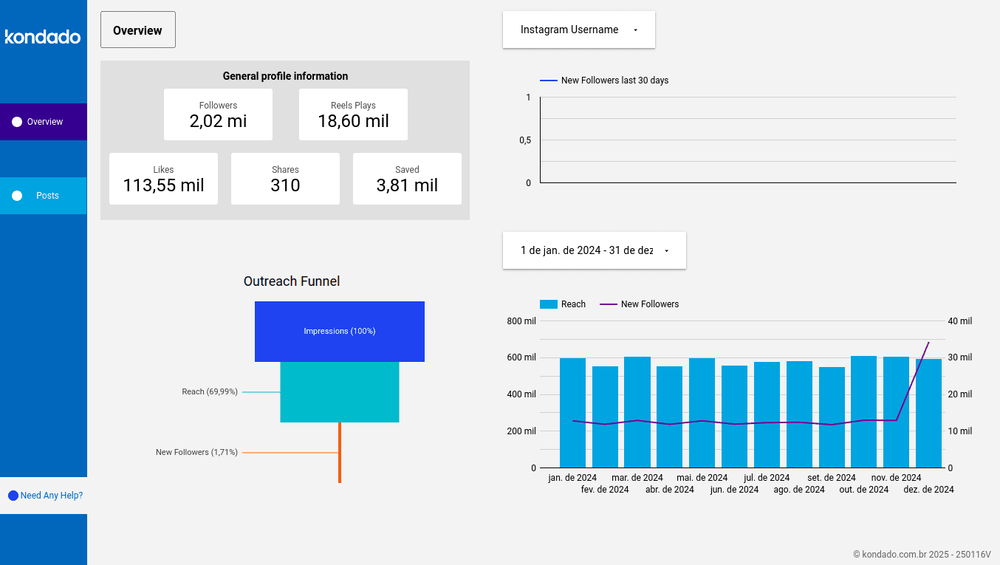
Overview Page
Provides a high-level summary of key Instagram metrics such as total followers, Reels plays, shares, and saves. You can also track follower growth over the past 30 days, analyze audience engagement trends, and gain monthly insights into reach expansion and follower increases. This helps you compare data, identify patterns, and refine your content strategy effectively.
Posts Page
Offers a detailed breakdown of post performance, including likes and saves, allowing you to identify trends and determine which content resonates most with your audience.
Key Instagram Metrics
To effectively measure your Instagram performance, tracking key metrics is essential. These indicators help assess the impact of your posts and how your audience interacts with your content. Here are some of the most important ones:
- Reach: Measures the number of unique users who have seen your content, regardless of whether they interacted with it. This is crucial for assessing how well your content is reaching new audiences and the overall effectiveness of your distribution strategy.
- Shares: Tracks how many times your post was shared by users, whether via direct message or reposted on Stories. A high share count indicates strong content virality and audience interest.
- Hashtags: Helps identify which hashtags are driving more visibility to your posts. Optimizing hashtag use can improve reach and attract a more targeted audience.
- Impressions: Counts the total number of times your post was displayed on users’ screens. Unlike reach, this metric includes multiple views from the same user, making it useful for evaluating content repetition in users’ feeds.
- Saved Posts: Tracks how many times your posts were saved by users to revisit later. A high number of saves often indicates valuable and relevant content.
- Engagement Rate: Reflects how actively users interact with your posts, factoring in likes, comments, saves, and shares relative to your follower count or reach. A higher engagement rate signals more compelling and relevant content.
Report Metrics
In our report, you’ll find essential metrics presented in interactive charts and tables, including:
New Followers Last 30 Days Chart – Displays daily fluctuations in new followers based on integrated data.
Outreach Funnel Chart – Shows the total volume of Impressions, Reach, and New Followers over the selected period.
Media product type filter - lets you filter data by content type: Feed, Reels, or Stories. It uses the media_product_type field, and that's exactly where most reports miscount Reels (see the box below).
Reels, Feed, and Stories: media_product_type vs media_type
Instagram exposes two fields that look alike, and confusing them is the most common reporting mistake:
media_product_typetells you where the post lives: AD, FEED, STORY, or REELS.media_typetells you the file format: IMAGE, CAROUSEL_ALBUM, or VIDEO.
To count Reels correctly, use media_product_type = 'REELS' as your dimension. If you use media_type = 'VIDEO' instead, Feed videos get counted too and the total is wrong - that's how a report ends up showing "37 Reels" when the account has 60. Kondado's template already uses the right field; if you customize the report, keep media_product_type to segment by format.
Stories metrics: what exists and what doesn't
Stories have no likes, comments, or saves in the Meta API. What exists are navigation metrics:
story_tap_forward- skip forward (a skip signal).story_tap_back- tap back / re-watch (a retention signal).story_tap_exit- exit the Stories sequence.story_replies- replies to the Story.
To measure Story retention, compare story_tap_back (re-watch) against story_tap_forward (skip). Asking for "Story likes" returns empty because the data doesn't exist - not because the report failed.
Performance Table – Identifies which traffic sources generate the most visits, helping you analyze session volume and refine your strategy.
Query your Instagram report in natural language with ChatGPT (via MCP)
The same data that powers your Looker Studio report also answers questions in ChatGPT and Claude. Once Kondado replicates your Instagram Business data into your Via Kondado, Kondado's MCP server (endpoint https://mcp.kondado.io/mcp) lets ChatGPT and Claude query those tables in KSQL and answer in plain English - no CSV export, no screenshots, no spreadsheet. Looker Studio tracks the recurring KPIs; the chat handles the ad-hoc question.
Example question you can ask right in the chat:
- "Using
media_product_type, compare average reach and averagetotal_interactionsacross Reels, Feed, and Stories over the last 90 days - which format performs best per post?"
Want the full setup walkthrough? See how to analyze Instagram data with ChatGPT.
Streamline your Instagram analytics with Kondado
Create an Instagram Report in Looker Studio with Kondado
Replicate Instagram Insights with Kondado and visualize it with the ready-made Looker Studio template.
Pick the Instagram report for Looker Studio
Choose the Instagram report template for Looker Studio so Kondado knows which sources and pipelines to set up.
Connect your Instagram account
Authorize Kondado to read Instagram Insights data, including reach, impressions, follower counts, and engagement metrics.
Wait for automated setup
Kondado replicates your Instagram data and provides a Looker Studio link. You'll be notified once the dashboard is ready.
Customize the dashboard
Open the report in Looker Studio. Use the Media product type filter to switch between Feed, Reels, and Stories, and adjust the period to track follower growth, reach, impressions, and the Outreach Funnel.