This guide details the features of Kondado's RD Station CRM report in Looker Studio: what each page and each visual shows, where the data comes from and how to use the report with your own data. Prefer Power BI? This same report is also available as a Power BI template — see the RD Station CRM Report Power BI documentation.
Table of Contents
- Pipelines and Models
- Accessing the Report in Looker Studio
- Report Features
- Comparison with the previous period
- Overview of the 5 Pages
- Calculated Fields
- Benefits of Analyzing This Data
Pipelines and Models
This report uses Kondado's RD Station CRM data source. When you create the report through the Use your own data button, Kondado creates 7 pipelines of the data source and 2 data models in your account, which deliver the information already joined and ready for the charts — you don't need to write any query.
The 7 pipelines
| Pipeline | What it brings | Initial load |
|---|---|---|
| Deals | CRM deals: name, value, status (won, lost, in progress, paused), creation and closing dates, owner, sales pipeline, stage, source and lost reason (as identifiers). | Last 90 days |
| Tasks | Tasks: subject, type, status (open, completed, canceled), due date, completion date, owners and the deal they belong to. | Last 90 days |
| Sales pipelines | The name of each sales pipeline. | Full |
| Stages | The name and order of each pipeline stage. | Full |
| Users | The name of each user (owner). | Full |
| Sources | The name of each deal source. | Full |
| Lost reasons | The name of each lost reason. | Full |
In RD Station CRM a deal stores its owner, sales pipeline, stage, source and lost reason only as identifiers; the names live in the other pipelines. That is why there are 7 — and why the models exist.
The 2 models — they are what feeds the report
- Enriched deals (table
rdm_deals) — one row per deal, with every field from the Deals pipeline plus the names already resolved:user_name(owner),deal_stage_pipeline_name(sales pipeline),deal_stage_nameanddeal_stage_order(stage and its order in the pipeline),deal_source_name(source) anddeal_lost_reason_name(lost reason). - Lost reasons (table
rdm_motivos_perda) — lost deals summarized bydate(deal creation date),user_name,deal_lost_reason_name,deal_stage_pipeline_nameanddeal_source_name, withtt= number of deals.
Looker Studio reads both models and the Tasks pipeline table. Some visuals join tasks with deals inside Looker Studio itself (each task linked to its deal through the deal_id field).
Need more history than the 90-day initial load? See How to change the savepoint in bulk and load more data.
Accessing the Report in Looker Studio
Just to look: the View the sample report button opens the report in view mode, with fictitious data and a fixed period (07/01/2026 to 10/23/2026). No account needed.
To use it with your own data:
- Click Use your own data (top of this page) and sign in to your Kondado account.
- Connect your RD Station CRM account.
- Kondado creates the 7 pipelines and 2 models described above and runs the initial load (deals and tasks from the last 90 days). This can take from a few minutes to a few hours, depending on volume.
- At the end of the flow, use the link to create your own copy of the report in Looker Studio, already connected to your data.
Your report opens with the period set to “last 3 months” (from the 1st day of three months ago until today), which moves forward by itself every day. Each page has its own date range control, at the top right.
The report has 5 pages, available from the left-side menu: Deals, Deals List, Tasks, Tasks List and Sales.
Report Features
- Side menu — leads to the 5 pages.
- Owner and Sales Pipeline filters — at the top of every page.
- Period — one per page. On the deals pages it applies to the creation date; on the tasks pages, to the task date; on Sales, to the sale date.
- Deal or task search — on both list pages, filters by Id, name, stage, status and type.
- Comparison with the previous period on the cards of the Deals, Tasks and Sales pages (see the section below).
- Footer buttons — free trial and help.
Comparison with the previous period
The cards on the Deals, Tasks and Sales pages show, under the number, the percentage change versus the previous period (green arrow = up, red = down) and a small month-by-month curve. What changes is which period Looker Studio calls previous — and that depends on how the period is configured:
| Where | Configured period | Previous period used for the comparison |
|---|---|---|
| Sample report (“View the sample report” button) | Fixed: 07/01/2026 to 10/23/2026 (115 days) | The same number of days immediately before: 03/08/2026 to 06/30/2026 |
| Your report (created through “Use your own data”) | Relative: “last 3 months” (from the 1st day of three months ago until today) | The same range shifted back by calendar months. Example: if today is 10/09, the period is 07/01 to 10/09 and the comparison is with 03/01 to 06/09 |
That is why the percentage in your report may differ from the one in the sample, even with similar data: with a relative period, Looker Studio compares calendar months, not the same number of days right before the current period. Neither is wrong — they are two of Looker Studio's own rules.
Want a day-for-day comparison, like in the sample? In the page's date range control, pick fixed (custom) dates. With a fixed period, the previous one becomes the same number of days immediately before.
The cards on the list pages (Deals List and Tasks List) have no comparison.
Overview of the 5 Pages
| Page | Question it answers |
|---|---|
| Deals | How is my sales funnel doing? |
| Deals List | Which deal needs attention right now? |
| Tasks | Is the team following up on opportunities? |
| Tasks List | What is on the team's agenda and what is overdue? |
| Sales | How much did we sell, how fast and at what win rate? |
Page: Deals
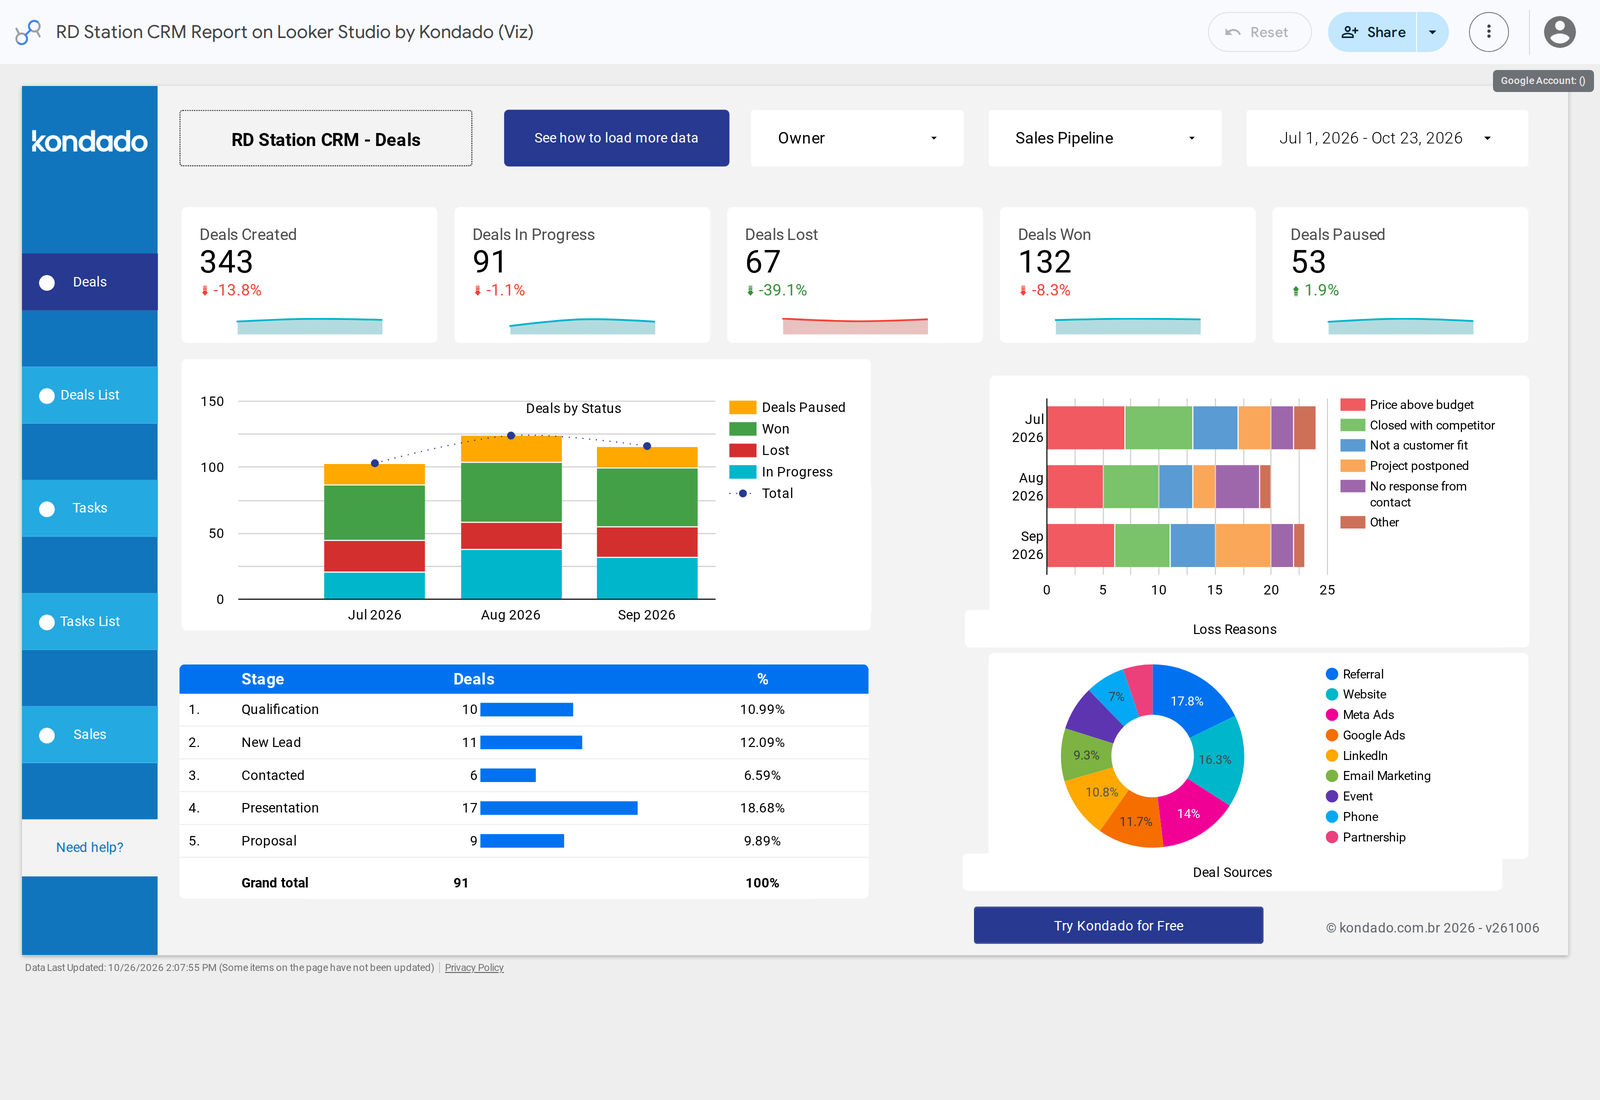
Overview of the sales funnel: how many deals came in during the period, how many were won, lost, paused or are still in progress, which stage the open ones are in, where they come from and why the lost ones were lost. This is the page that answers “how is my funnel doing?” — useful for the sales manager in the weekly meeting and for anyone who needs a quick picture of the team.
Owner (Filter (drop-down list))
Filters the page by the salesperson who owns the deal.
- Pipeline / data model: Enriched deals model (table
rdm_deals) - Field(s) used:
user_name(owner name)
Sales Pipeline (Filter (drop-down list))
Filters the page by RD Station CRM sales pipeline.
- Pipeline / data model: Enriched deals model (table
rdm_deals) - Field(s) used:
deal_stage_pipeline_name(pipeline name)
Period (Date range control)
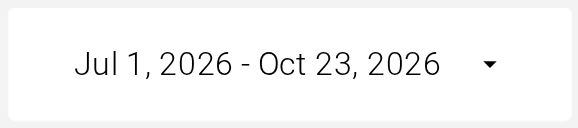
Slices every visual on the page by the deal's creation date (in the lost reasons chart, by the creation date of the lost deal).
- Pipeline / data model: Enriched deals model (table
rdm_deals) - Field(s) used:
created_at(deal creation date)
Deals Created (Scorecard)
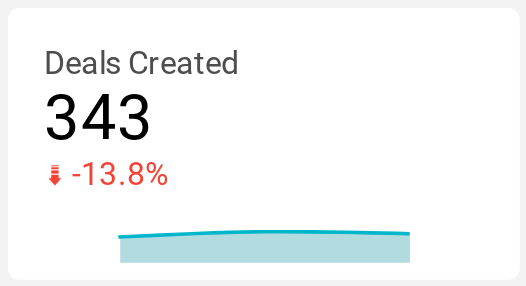
Number of deals created in the period, in every status. Shows the change versus the previous period.
- Pipeline / data model: Enriched deals model (table
rdm_deals) - Field(s) used:
id, dated bycreated_at - Aggregation: Count of deals
Deals In Progress (Scorecard)
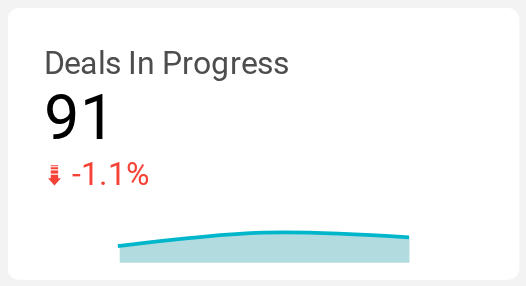
Deals created in the period that are still open (not won, lost or paused). Shows the change versus the previous period.
- Pipeline / data model: Enriched deals model (table
rdm_deals) - Field(s) used:
status=ongoing - Aggregation: Count
Deals Lost (Scorecard)
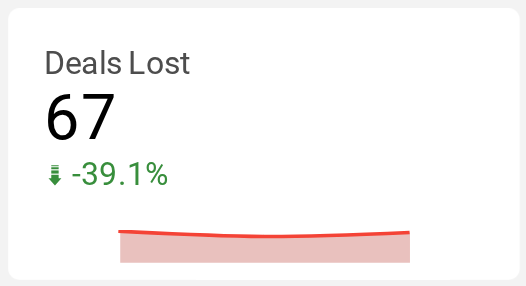
Deals created in the period that are now lost. Shows the change versus the previous period.
- Pipeline / data model: Enriched deals model (table
rdm_deals) - Field(s) used:
status=lost - Aggregation: Count
Deals Won (Scorecard)
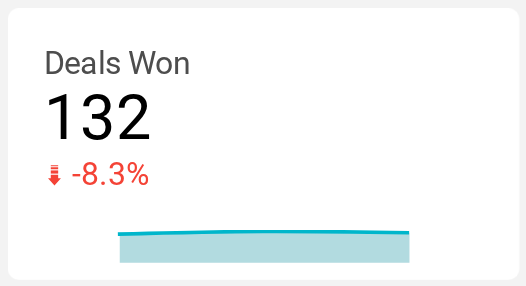
Deals created in the period that are now won. Shows the change versus the previous period.
- Pipeline / data model: Enriched deals model (table
rdm_deals) - Field(s) used:
status=won - Aggregation: Count
Deals Paused (Scorecard)
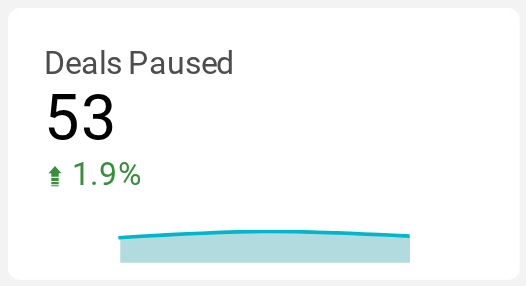
Deals created in the period that are paused in RD Station CRM. Paused is the fourth status a deal can have — without it, won + lost + in progress would not add up to the total created. Shows the change versus the previous period.
- Pipeline / data model: Enriched deals model (table
rdm_deals) - Field(s) used:
status=paused - Aggregation: Sum of 1 per paused deal
Deals by Status (Combo chart (stacked columns + line))
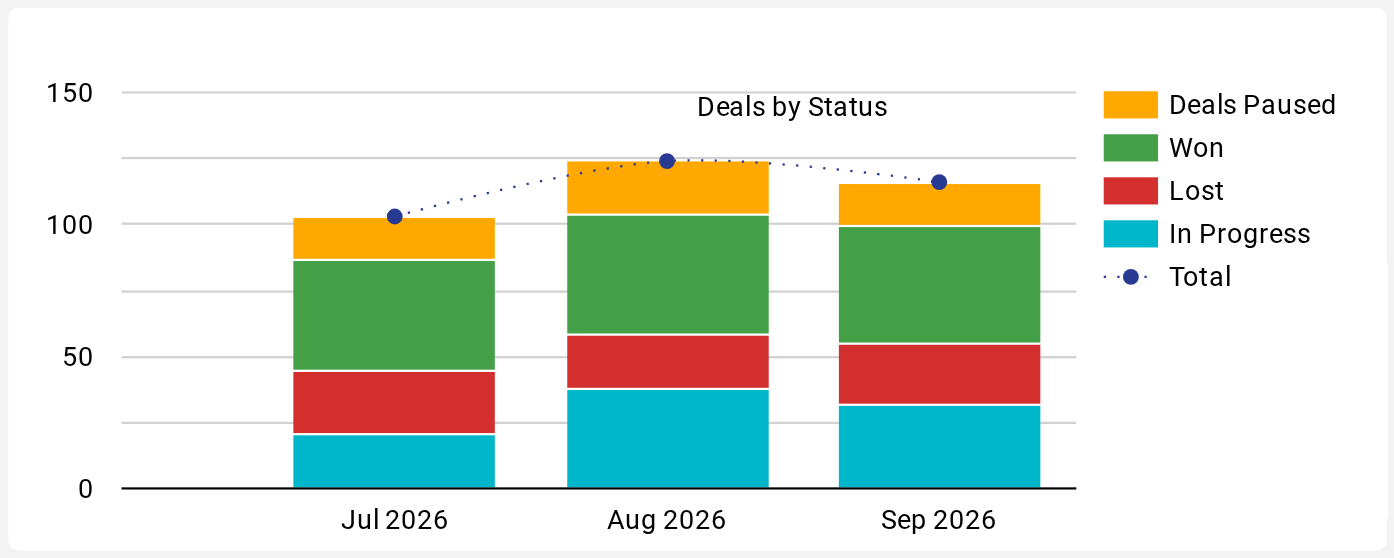
Month by month (by creation date), the deals created split by status — in progress, lost, won and paused — with a line for the month's total.
- Pipeline / data model: Enriched deals model (table
rdm_deals) - Field(s) used:
created_at(grouped by month),status,id - Aggregation: Count per status; line = total count
Stage (Table)
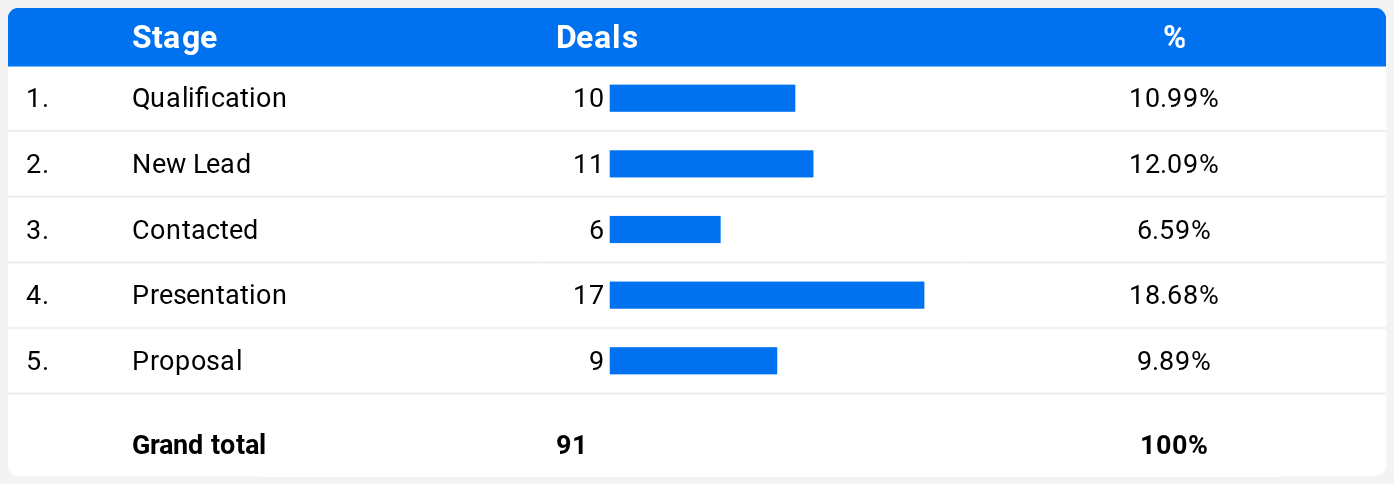
Of the ongoing deals, how many are in each funnel stage, in the order of the stages in your RD Station CRM, with a proportional bar and each stage's share.
- Pipeline / data model: Enriched deals model (table
rdm_deals) - Field(s) used:
deal_stage_name(stage name), sorted bydeal_stage_order; count wherestatus=ongoing - Aggregation: Count and % of total
Deal Sources (Donut chart)
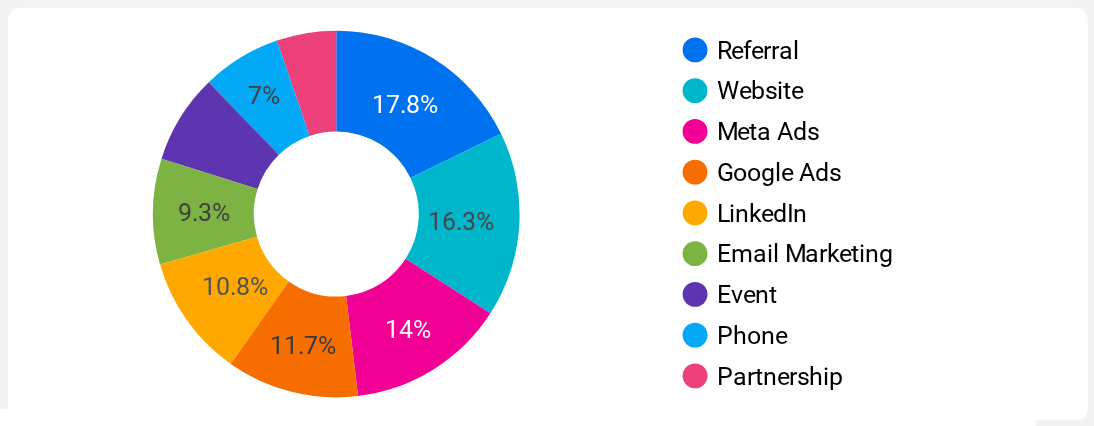
Where the deals created in the period came from (the source registered in RD Station CRM: website, referral, ads, event…), as a share of the total.
- Pipeline / data model: Enriched deals model (table
rdm_deals) - Field(s) used:
deal_source_name(source name) - Aggregation: Count of deals created
Loss Reasons (Stacked horizontal bar chart)
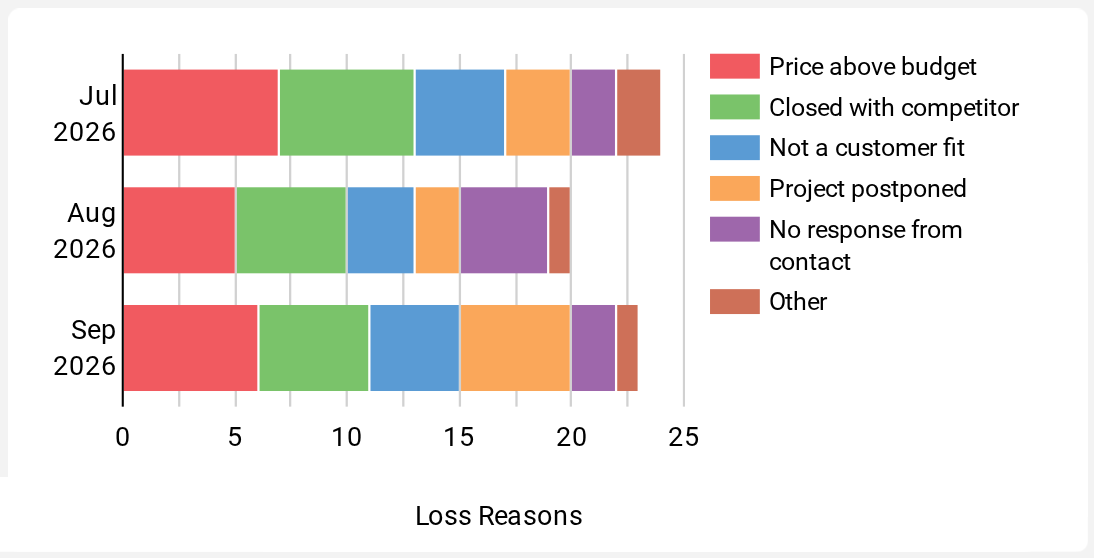
Per month, how many deals were lost and for which lost reason. The month is the lost deal's creation month (not the closing month) — the same date criterion as the rest of the page.
- Pipeline / data model: Lost reasons model (table
rdm_motivos_perda) - Field(s) used:
date(grouped by month),deal_lost_reason_name,tt(number of deals) - Aggregation: Sum of
tt
Page: Deals List
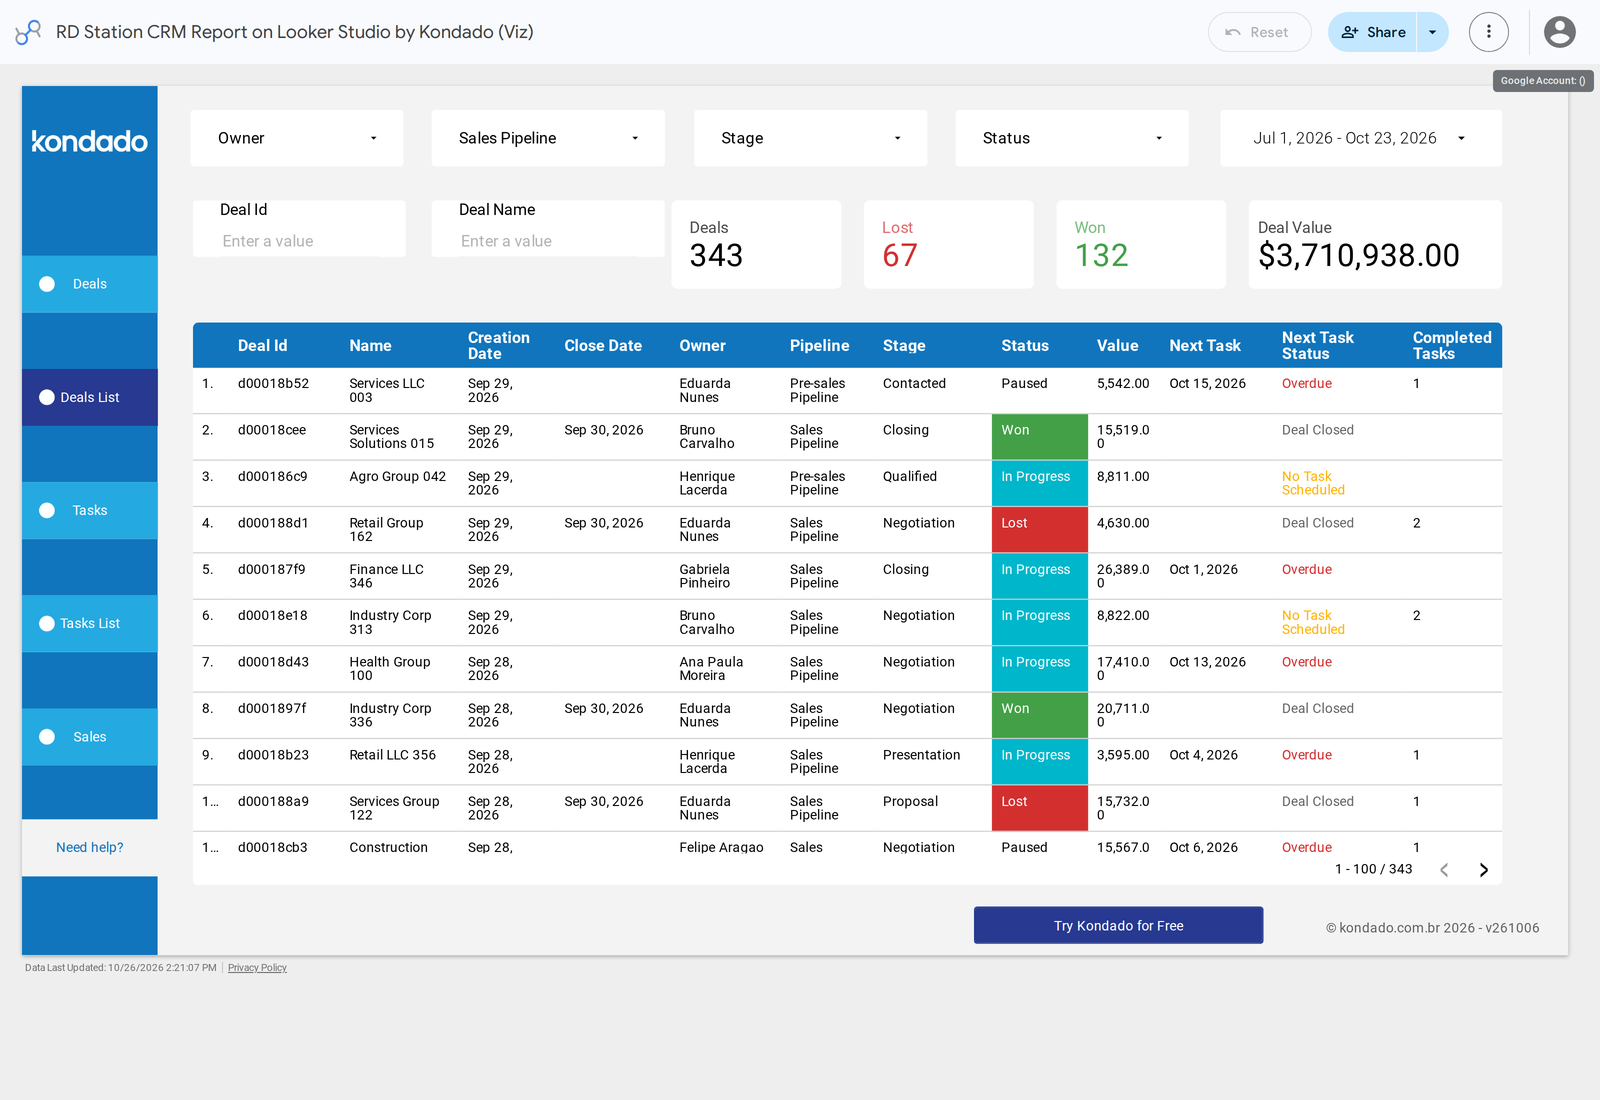
The same deals base, now row by row: each deal with its owner, sales pipeline, stage, status, value, the date of the next scheduled task and whether that task is on time. This is the page to act on — find the stalled deal, the deal with no next task or with an overdue task, and follow up with the owner.
Owner (Filter (drop-down list))
Filters the list by owner.
- Pipeline / data model: Enriched deals model joined with the Tasks pipeline (each deal with its tasks, by
id=deal_id) - Field(s) used:
user_name
Sales Pipeline (Filter (drop-down list))
Filters the list by sales pipeline.
- Pipeline / data model: Enriched deals model joined with the Tasks pipeline (each deal with its tasks, by
id=deal_id) - Field(s) used:
deal_stage_pipeline_name
Stage (Filter (drop-down list))
Filters the list by the deal's current stage.
- Pipeline / data model: Enriched deals model joined with the Tasks pipeline (each deal with its tasks, by
id=deal_id) - Field(s) used:
deal_stage_name
Status (Filter (drop-down list))
Filters by status: Ganha (won), Perdida (lost), Pausada (paused) or Em Andamento (ongoing).
- Pipeline / data model: Enriched deals model joined with the Tasks pipeline (each deal with its tasks, by
id=deal_id) - Field(s) used: calculated field Status, which translates
status
Period (Date range control)
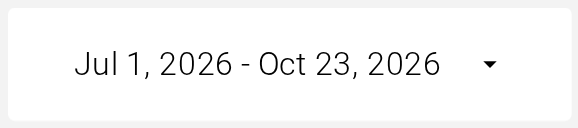
Slices the list and the cards by deal creation date.
- Pipeline / data model: Enriched deals model joined with the Tasks pipeline (each deal with its tasks, by
id=deal_id) - Field(s) used:
created_at
Deal Id (Filter (search box))

Finds a specific deal by its identifier.
- Pipeline / data model: Enriched deals model joined with the Tasks pipeline (each deal with its tasks, by
id=deal_id) - Field(s) used:
id
Deal Name (Filter (search box))

Finds a deal by its name.
- Pipeline / data model: Enriched deals model joined with the Tasks pipeline (each deal with its tasks, by
id=deal_id) - Field(s) used:
name
Deals (Scorecard)
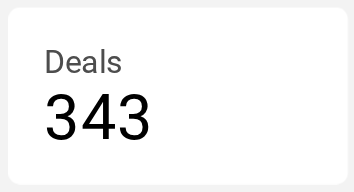
Number of deals in the list, after filters.
- Pipeline / data model: Enriched deals model joined with the Tasks pipeline (each deal with its tasks, by
id=deal_id) - Field(s) used:
id - Aggregation: Distinct count
Lost (Scorecard)
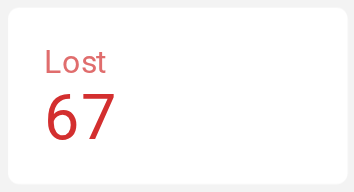
How many deals in the list are lost.
- Pipeline / data model: Enriched deals model joined with the Tasks pipeline (each deal with its tasks, by
id=deal_id) - Field(s) used:
id, filtered by Status = Perdida - Aggregation: Distinct count
Won (Scorecard)
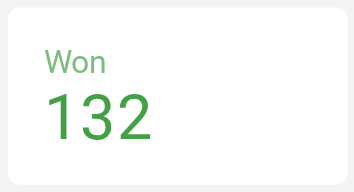
How many deals in the list are won.
- Pipeline / data model: Enriched deals model joined with the Tasks pipeline (each deal with its tasks, by
id=deal_id) - Field(s) used:
id, filtered by Status = Ganha - Aggregation: Distinct count
Deal Value (Scorecard)
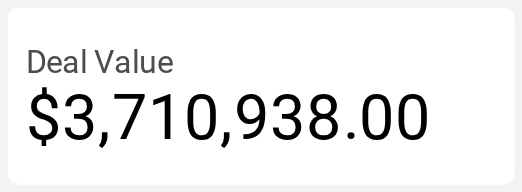
Sum of the value of every deal in the list, in any status.
- Pipeline / data model: Enriched deals model joined with the Tasks pipeline (each deal with its tasks, by
id=deal_id) - Field(s) used:
total_price(total deal value = one-time + recurring value) - Aggregation: Sum
Deals List (Table)
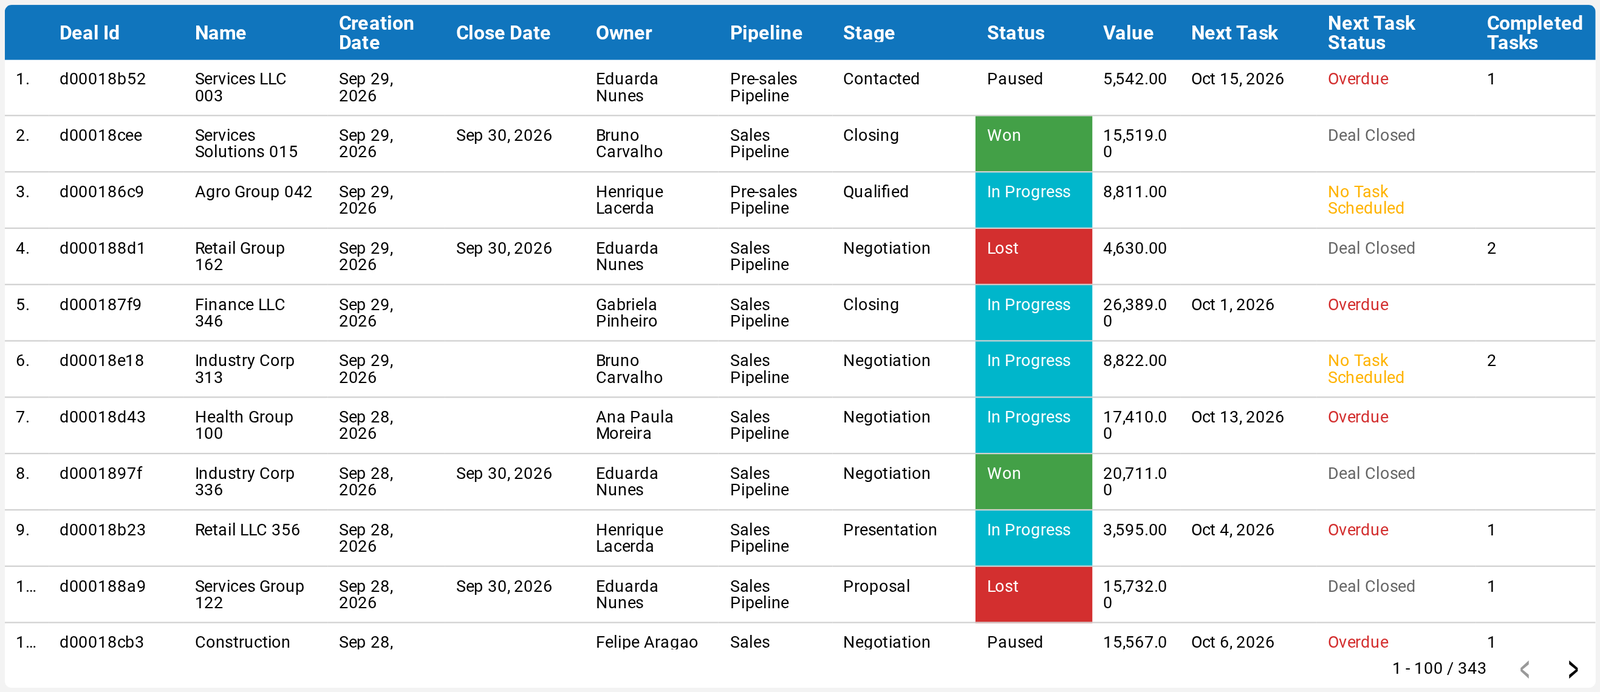
One row per deal: Id, Name, Creation Date, Closing Date, Owner, Pipeline, Stage, Status, Value, Next Task (date of the nearest open task — empty if the deal is already closed), Next Task Status (Overdue, On Time, No Task Scheduled or Deal Closed, color-coded) and the deal's Completed Tasks.
- Pipeline / data model: Enriched deals model joined with the Tasks pipeline (each deal with its tasks, by
id=deal_id) - Field(s) used:
id,name,created_at,closed_at,user_name,deal_stage_pipeline_name,deal_stage_name,status,total_price; from tasks:due_dateandcompleted_at - Aggregation: Next Task = earliest date of a not-yet-completed task; Completed Tasks = count
Page: Tasks
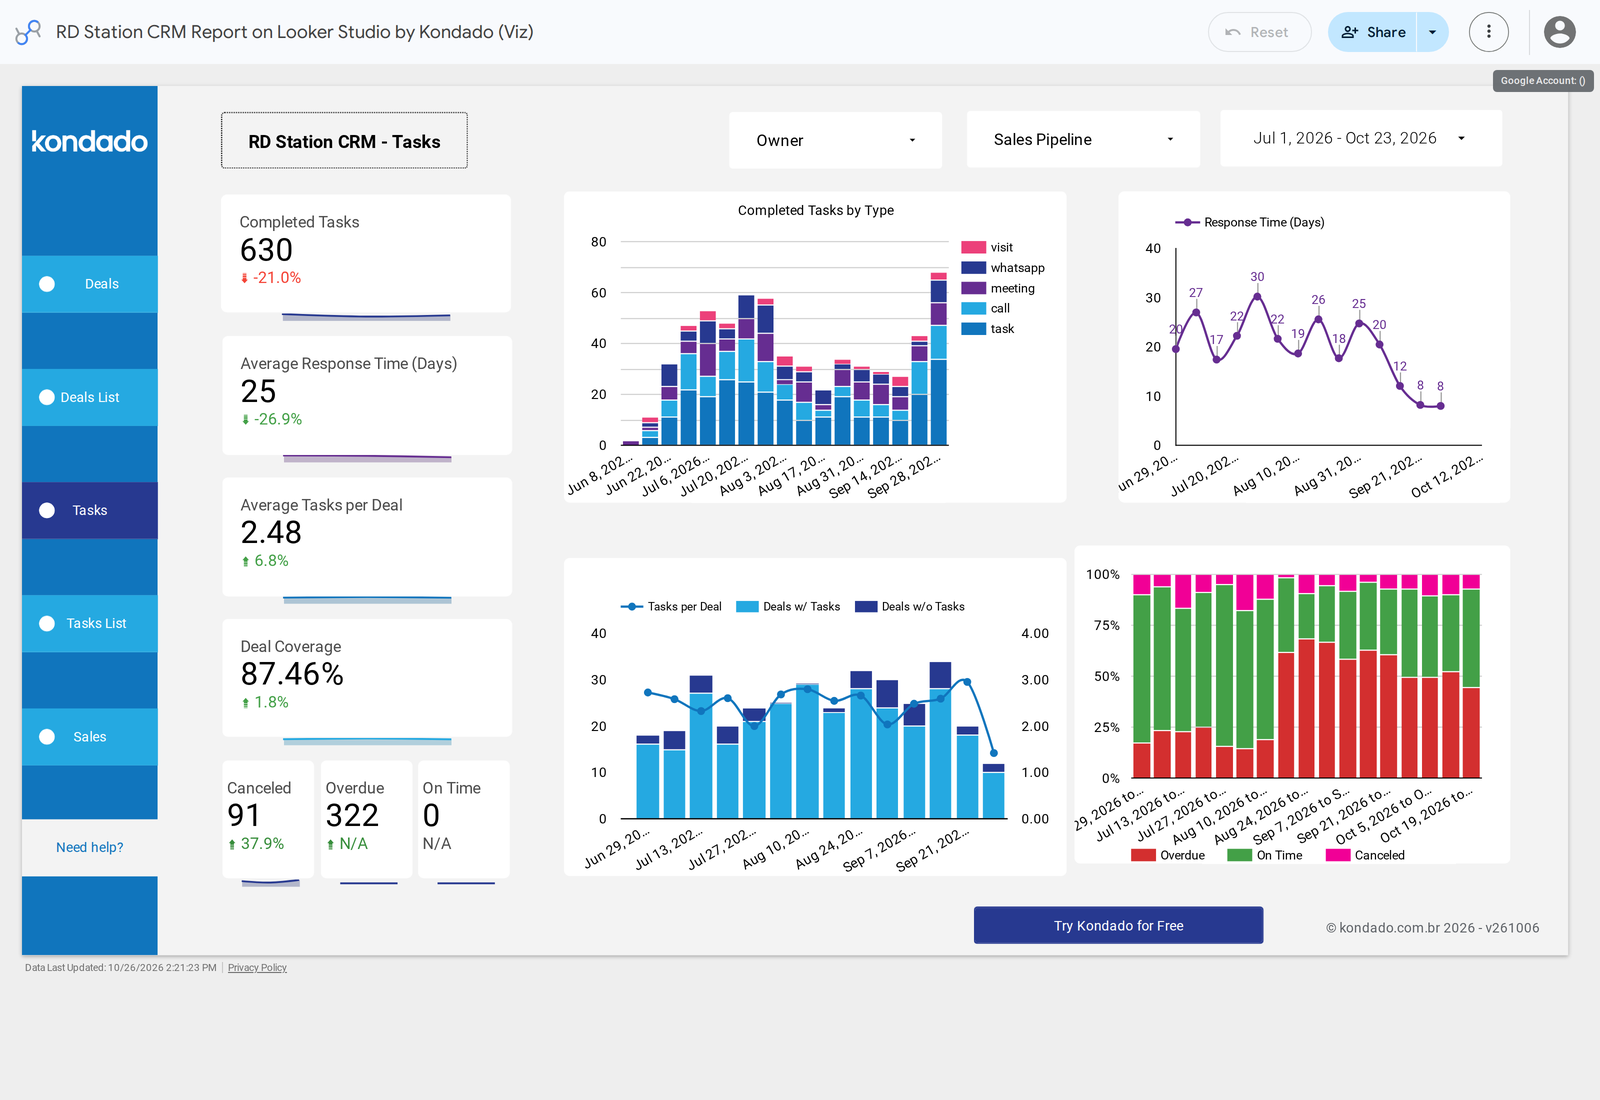
Measures the team's follow-up discipline: how many tasks were completed, canceled, are overdue or on time, how long the team takes to give the first response to a new deal, how many tasks each deal gets and how many deals got no task at all. It answers “is the team working the opportunities that come in?”
Owner (Filter (drop-down list))
Filters the page by task owner.
- Pipeline / data model: Tasks pipeline joined with the Enriched deals model (each task linked to its deal by
deal_id=id) - Field(s) used: task owner name (
owner_names)
Sales Pipeline (Filter (drop-down list))
Filters by the pipeline of the deal the task belongs to.
- Pipeline / data model: Tasks pipeline joined with the Enriched deals model (each task linked to its deal by
deal_id=id) - Field(s) used: the deal's
deal_stage_pipeline_name
Period (Date range control)
Slices the page by task (due) date. Response and coverage indicators use the deal creation date.
- Pipeline / data model: Tasks pipeline joined with the Enriched deals model (each task linked to its deal by
deal_id=id) - Field(s) used:
due_date(tasks) andcreated_at(deals)
Completed Tasks (Scorecard)
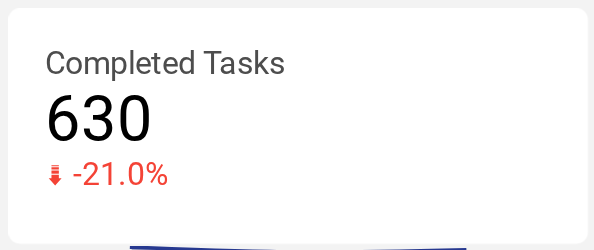
Tasks in the period with completed status. A canceled task does not count, even though it has a completion date. Shows the change versus the previous period.
- Pipeline / data model: Tasks pipeline joined with the Enriched deals model (each task linked to its deal by
deal_id=id) - Field(s) used:
status=completed - Aggregation: Count
Average Response Time (Days) (Scorecard)
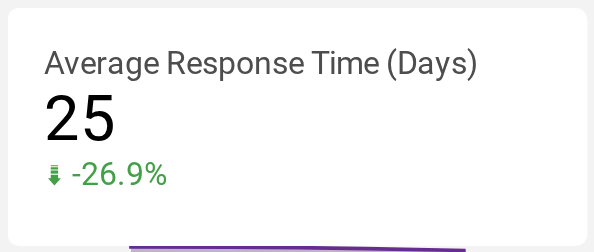
On average, how many days passed between the deal's creation and the first completed task on it. A deal with no completed task counts the days up to today — so the number grows by itself every day while there are unanswered deals. Shows the change versus the previous period.
- Pipeline / data model: Enriched deals model joined with the Tasks pipeline (each deal with its tasks, by
id=deal_id) - Field(s) used:
created_at(deal), earliest taskcompleted_at - Aggregation: Average of days
Average Tasks per Deal (Scorecard)
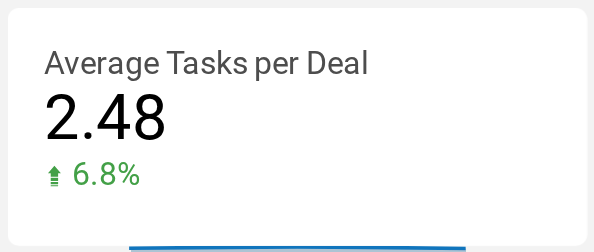
How many tasks, on average, each deal created in the period got (a deal with no task counts as zero). Shows the change versus the previous period.
- Pipeline / data model: Enriched deals model joined with the Tasks pipeline (each deal with its tasks, by
id=deal_id) - Field(s) used: task count per deal
id - Aggregation: Average
Deal Coverage (Scorecard)
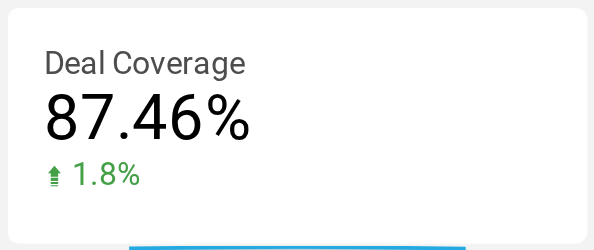
Share of the deals created in the period that have at least one task. Shows the change versus the previous period.
- Pipeline / data model: Enriched deals model joined with the Tasks pipeline (each deal with its tasks, by
id=deal_id) - Field(s) used: deals with a task ÷ deals (
id) - Aggregation: Percentage
Canceled (Scorecard)
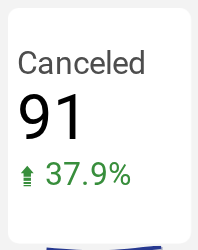
Tasks in the period that were canceled. Shows the change versus the previous period.
- Pipeline / data model: Tasks pipeline joined with the Enriched deals model (each task linked to its deal by
deal_id=id) - Field(s) used:
status=canceled - Aggregation: Count
Overdue (Scorecard)
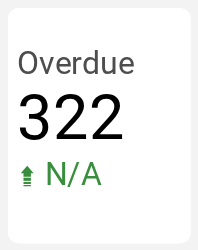
Open tasks (not completed, not canceled) whose date has already passed. Depends on today's date. Shows the change versus the previous period.
- Pipeline / data model: Tasks pipeline joined with the Enriched deals model (each task linked to its deal by
deal_id=id) - Field(s) used:
status,completed_at,due_date< today - Aggregation: Count
On Time (Scorecard)
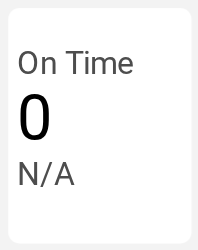
Open tasks whose date is today or in the future. Depends on today's date. Shows the change versus the previous period.
- Pipeline / data model: Tasks pipeline joined with the Enriched deals model (each task linked to its deal by
deal_id=id) - Field(s) used:
status,completed_at,due_date≥ today - Aggregation: Count
Completed Tasks by Type (Stacked column chart)
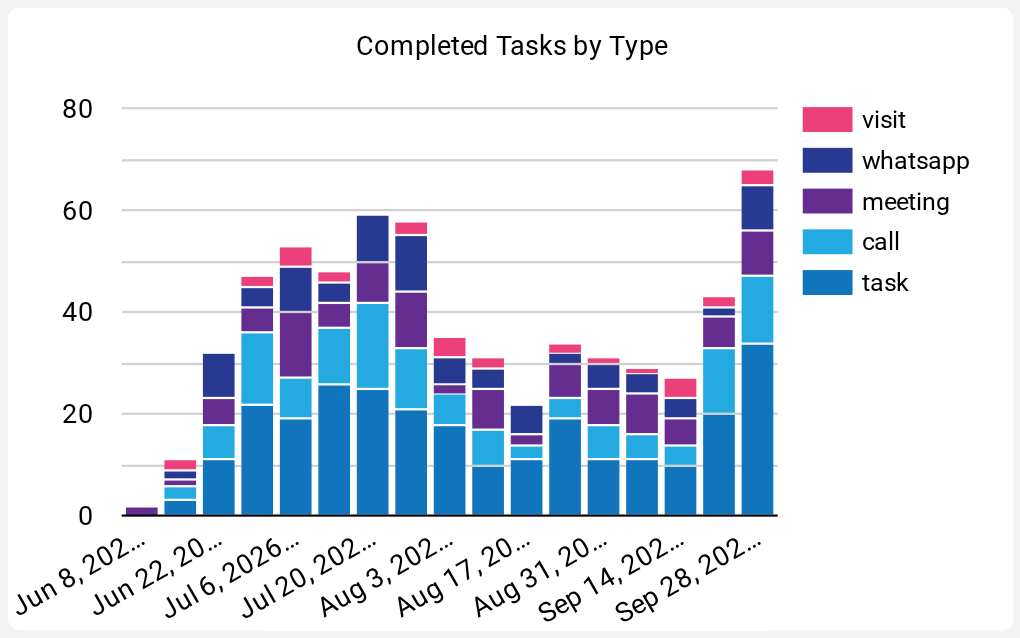
Week by week, completed tasks split by type (call, email, meeting, task, lunch, visit, WhatsApp).
- Pipeline / data model: Tasks pipeline joined with the Enriched deals model (each task linked to its deal by
deal_id=id) - Field(s) used:
completed_at(by week),type - Aggregation: Count of completed
Response Time (Days) (Line chart)
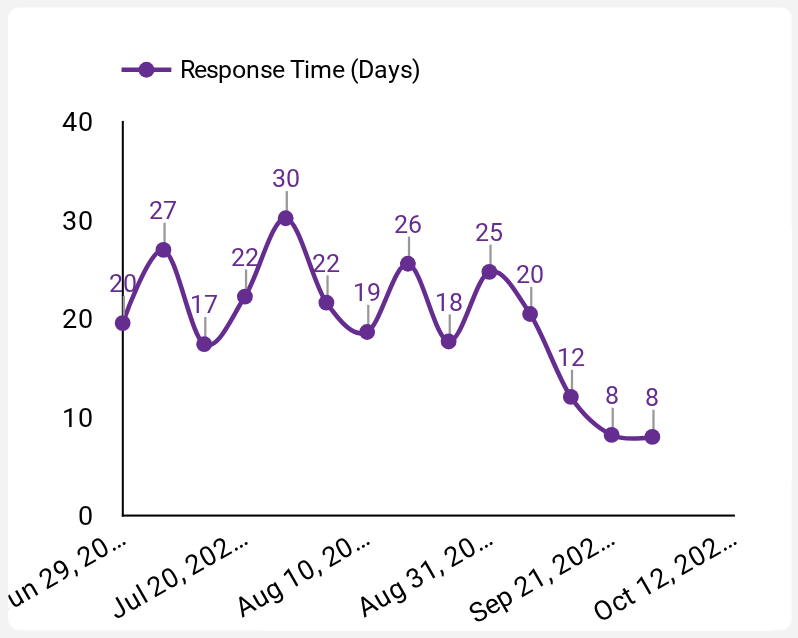
Average response time, week by week, by the deal's creation week — shows whether the team is answering faster or slower.
- Pipeline / data model: Enriched deals model joined with the Tasks pipeline (each deal with its tasks, by
id=deal_id) - Field(s) used:
created_at(by week), earliest taskcompleted_at,closed_at - Aggregation: Average of days
Tasks per Deal (Combo chart (stacked columns + line))
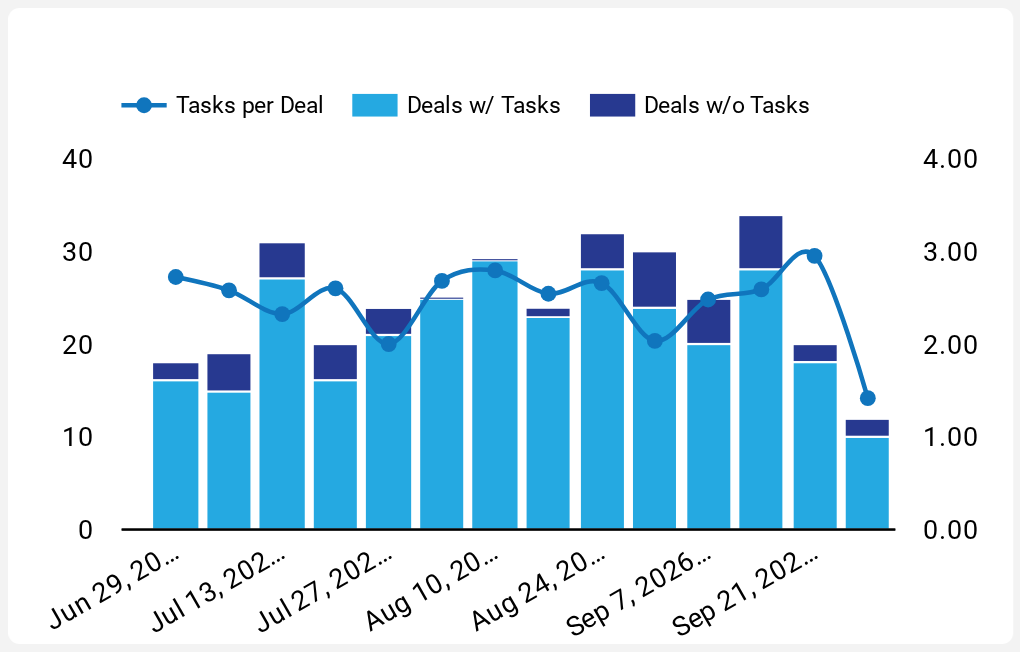
By creation week, how many deals got a task (bars Deals w/ Tasks), how many got none (Deals w/o Tasks) and the average tasks per deal (line).
- Pipeline / data model: Enriched deals model joined with the Tasks pipeline (each deal with its tasks, by
id=deal_id) - Field(s) used:
created_at(by week), task count perid - Aggregation: Counts and average
Overdue, On Time and Canceled (100% stacked column chart)
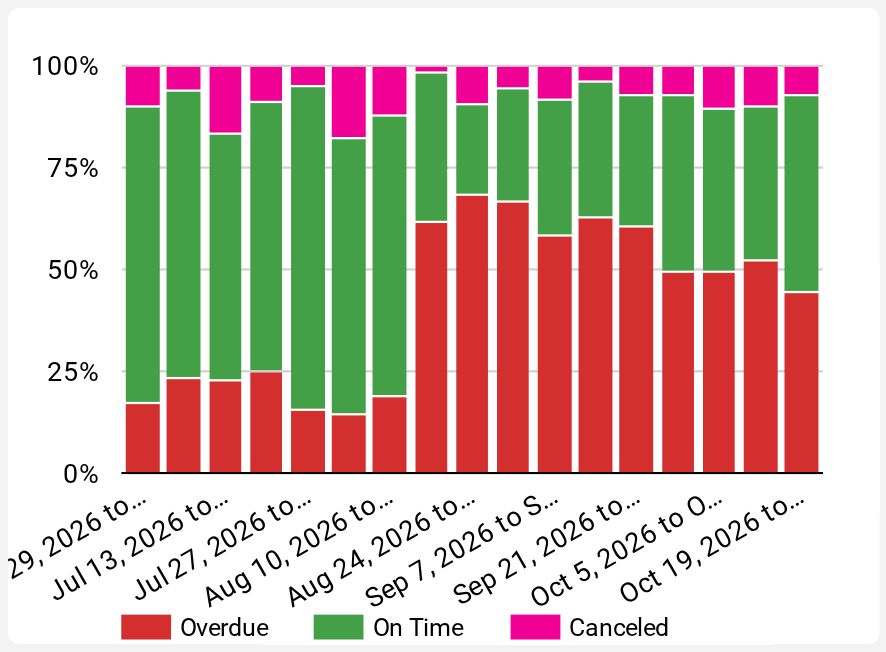
Week by week, the share of tasks that are Atrasadas (overdue: completed after the due date, or open and past due), Em Dia (on time) and Canceladas (canceled).
- Pipeline / data model: Tasks pipeline joined with the Enriched deals model (each task linked to its deal by
deal_id=id) - Field(s) used:
due_date(by week),status,completed_at - Aggregation: Count per category, as %
Page: Tasks List
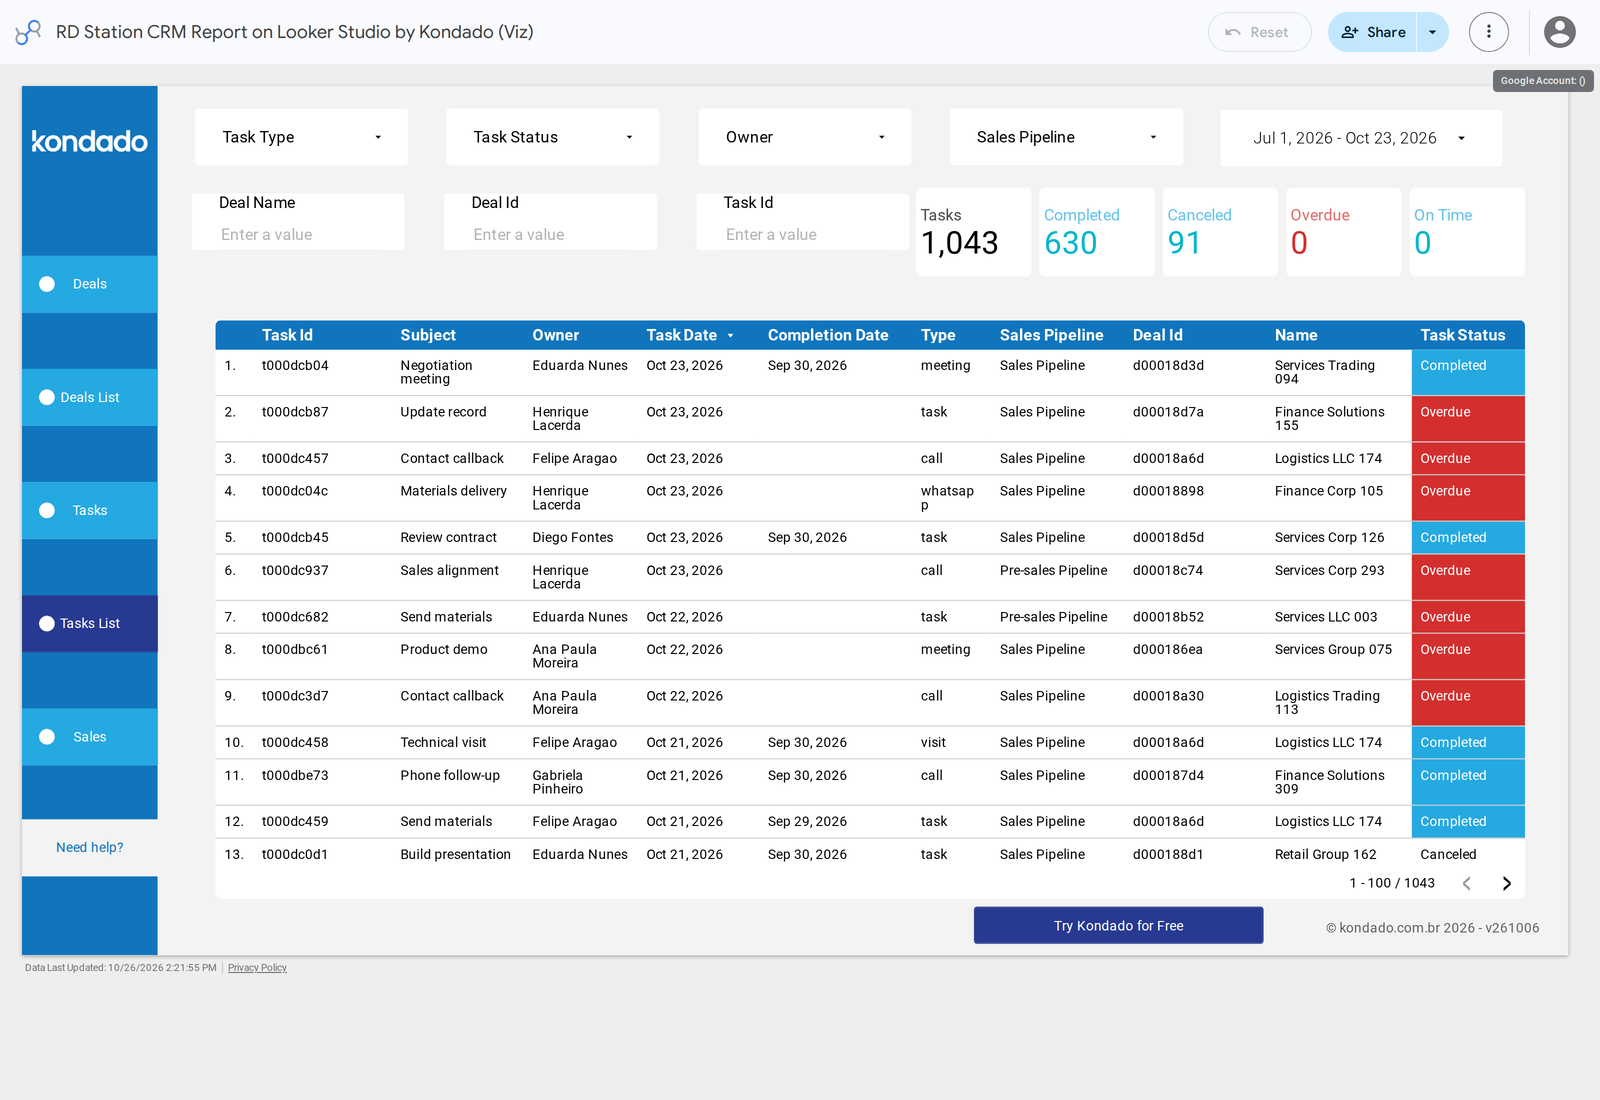
CRM tasks row by row, with subject, owner, due date, completion date, type, sales pipeline, the deal they belong to and their status (completed, canceled, overdue or on time). This is the operational page to review the team's agenda and find what was left behind.
Task Type (Filter (drop-down list))
Filters by task type.
- Pipeline / data model: Tasks pipeline joined with the Enriched deals model (each task linked to its deal by
deal_id=id) - Field(s) used:
type
Task Status (Filter (drop-down list))
Filters by Concluída (completed), Cancelada (canceled), Atraso (overdue) or Ok (on time).
- Pipeline / data model: Tasks pipeline joined with the Enriched deals model (each task linked to its deal by
deal_id=id) - Field(s) used: calculated field Status Tarefa (from
status,completed_atanddue_date)
Owner (Filter (drop-down list))
Filters by task owner.
- Pipeline / data model: Tasks pipeline joined with the Enriched deals model (each task linked to its deal by
deal_id=id) - Field(s) used:
owner_names
Sales Pipeline (Filter (drop-down list))
Filters by the pipeline of the task's deal.
- Pipeline / data model: Tasks pipeline joined with the Enriched deals model (each task linked to its deal by
deal_id=id) - Field(s) used:
deal_stage_pipeline_name
Period (Date range control)
Slices the list by task date.
- Pipeline / data model: Tasks pipeline joined with the Enriched deals model (each task linked to its deal by
deal_id=id) - Field(s) used:
due_date
Deal Name (Filter (search box))

Shows only one deal's tasks, by name.
- Pipeline / data model: Tasks pipeline joined with the Enriched deals model (each task linked to its deal by
deal_id=id) - Field(s) used: the deal's
name
Deal Id (Filter (search box))

Shows only one deal's tasks, by identifier.
- Pipeline / data model: Tasks pipeline joined with the Enriched deals model (each task linked to its deal by
deal_id=id) - Field(s) used:
deal_id
Task Id (Filter (search box))

Finds a specific task.
- Pipeline / data model: Tasks pipeline joined with the Enriched deals model (each task linked to its deal by
deal_id=id) - Field(s) used: task
id
Tasks (Scorecard)
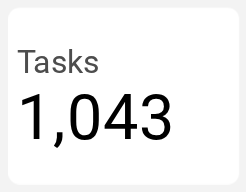
Total tasks in the list.
- Pipeline / data model: Tasks pipeline joined with the Enriched deals model (each task linked to its deal by
deal_id=id) - Field(s) used:
id - Aggregation: Count
Completed (Scorecard)
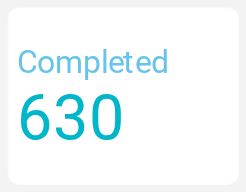
Tasks in the list with Concluída status.
- Pipeline / data model: Tasks pipeline joined with the Enriched deals model (each task linked to its deal by
deal_id=id) - Field(s) used: Status Tarefa = Concluída
- Aggregation: Count
Canceled (Scorecard)
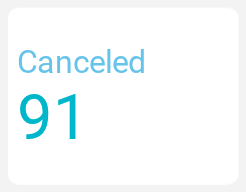
Canceled tasks in the list.
- Pipeline / data model: Tasks pipeline joined with the Enriched deals model (each task linked to its deal by
deal_id=id) - Field(s) used: Status Tarefa = Cancelada
- Aggregation: Count
Overdue (Scorecard)
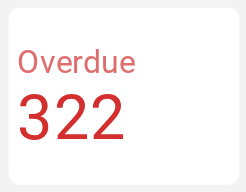
Open, past-due tasks in the list.
- Pipeline / data model: Tasks pipeline joined with the Enriched deals model (each task linked to its deal by
deal_id=id) - Field(s) used: Status Tarefa = Atraso
- Aggregation: Count
On Time (Scorecard)
Open tasks in the list that are within the due date.
- Pipeline / data model: Tasks pipeline joined with the Enriched deals model (each task linked to its deal by
deal_id=id) - Field(s) used: Status Tarefa = Ok
- Aggregation: Count
Tasks List (Table)
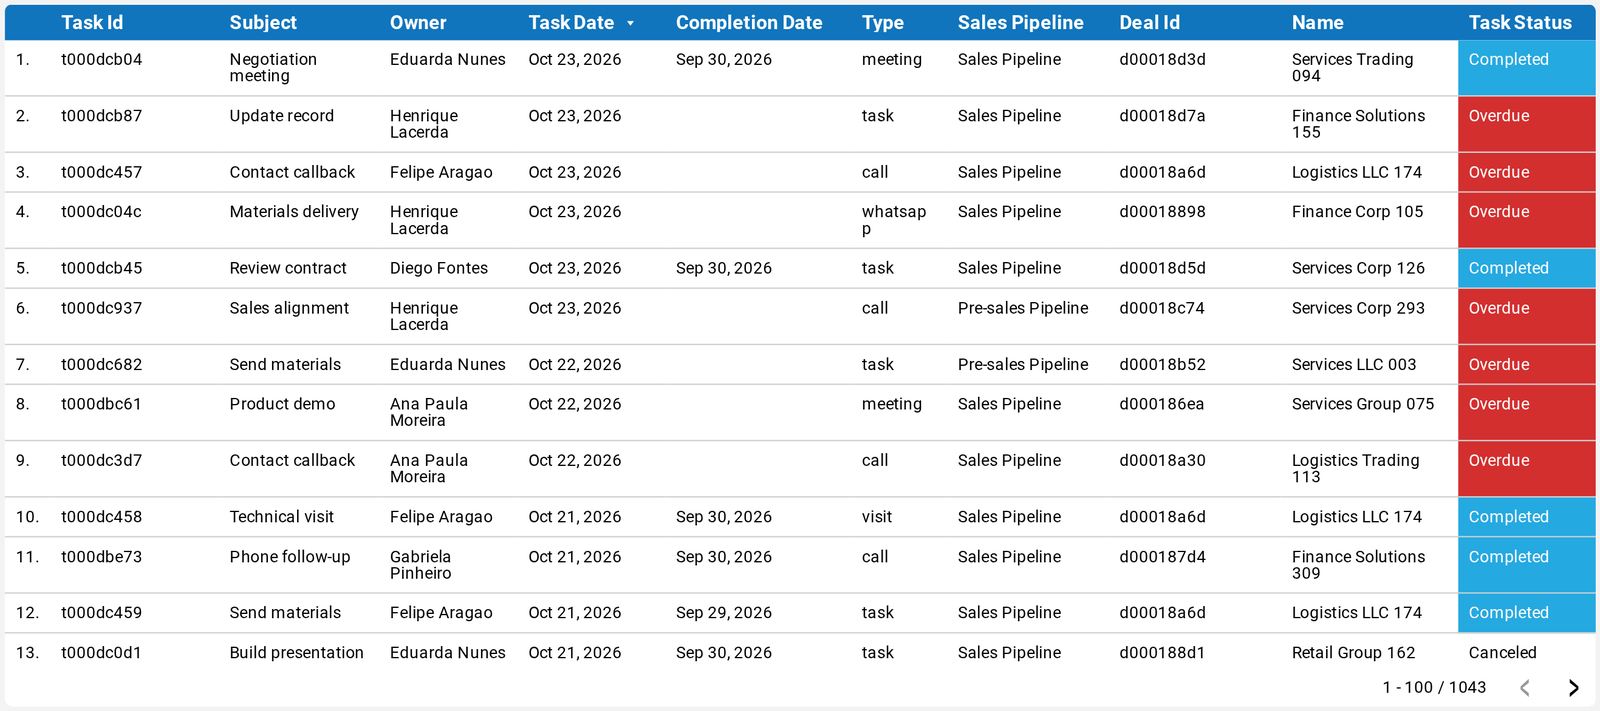
One row per task: Task Id, Subject, Owner, Task Date, Completion Date, Type, Sales Pipeline, Deal Id, Deal Name and Task Status (color-coded).
- Pipeline / data model: Tasks pipeline joined with the Enriched deals model (each task linked to its deal by
deal_id=id) - Field(s) used:
id,name(subject),owner_names,due_date,completed_at,type,deal_stage_pipeline_name,deal_id, dealname, Status Tarefa
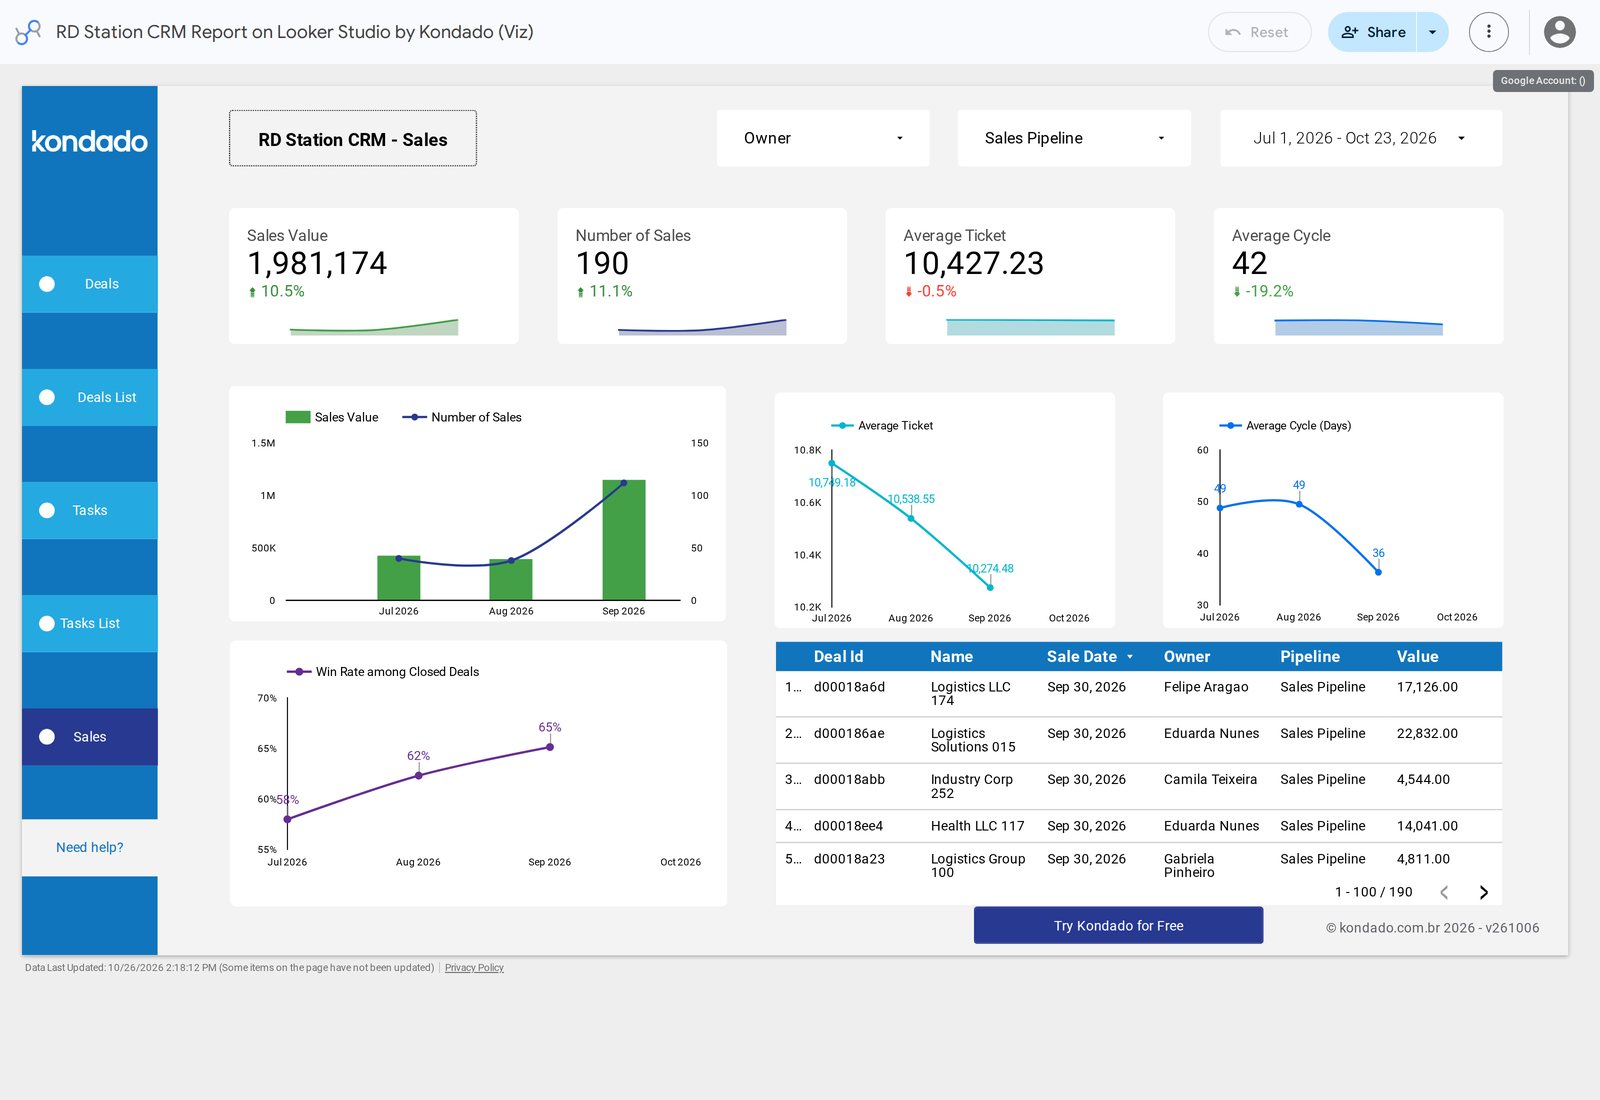
Page: Sales
The funnel's outcome: how much was sold (won deals), how many sales, average ticket, how long a deal takes from creation to being won and the win rate among closed deals, month by month. It answers “how much did we sell, how fast and how efficiently?”
Owner (Filter (drop-down list))
Filters the page by salesperson.
- Pipeline / data model: Enriched deals model (table
rdm_deals) - Field(s) used:
user_name
Sales Pipeline (Filter (drop-down list))
Filters the page by pipeline.
- Pipeline / data model: Enriched deals model (table
rdm_deals) - Field(s) used:
deal_stage_pipeline_name
Period (Date range control)
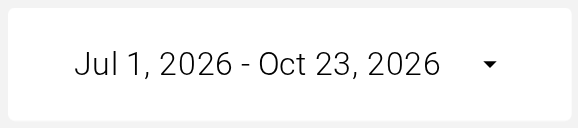
On this page the period applies to the sale date (closing date of the won deal), not the creation date.
- Pipeline / data model: Enriched deals model (table
rdm_deals) - Field(s) used:
closed_atof won deals
Sales Value (Scorecard)
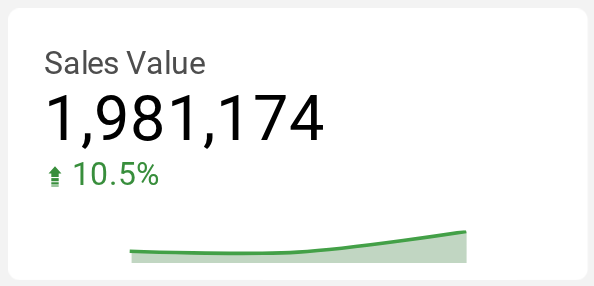
Sum of the value of the deals won in the period. Shows the change versus the previous period.
- Pipeline / data model: Enriched deals model (table
rdm_deals) - Field(s) used:
total_priceof deals withstatus=won, dated byclosed_at(sale date) - Aggregation: Sum
Number of Sales (Scorecard)
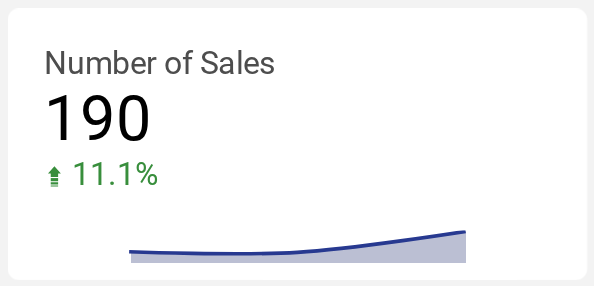
Number of deals won in the period. Shows the change versus the previous period.
- Pipeline / data model: Enriched deals model (table
rdm_deals) - Field(s) used:
idof deals withstatus=won, dated byclosed_at(sale date) - Aggregation: Count
Average Ticket (Scorecard)
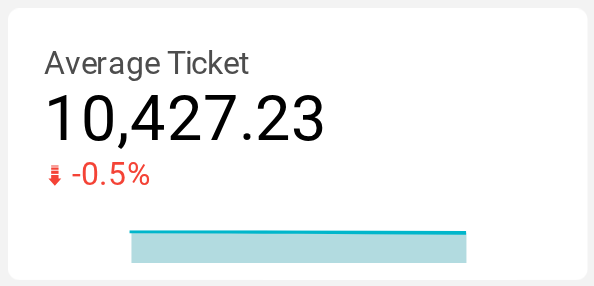
Average value per sale: Sales Value ÷ Number of Sales. Shows the change versus the previous period.
- Pipeline / data model: Enriched deals model (table
rdm_deals) - Field(s) used:
total_priceof deals withstatus=won, dated byclosed_at(sale date) - Aggregation: Average
Average Cycle (Scorecard)
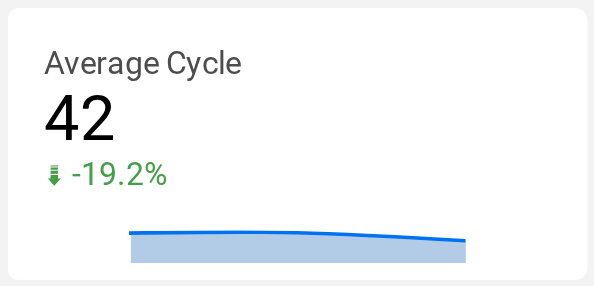
On average, how many days a won deal took from creation to sale. Shows the change versus the previous period.
- Pipeline / data model: Enriched deals model (table
rdm_deals) - Field(s) used: days between
created_atandclosed_atof won deals - Aggregation: Average of days
Sales Value (monthly) (Combo chart (columns + line))
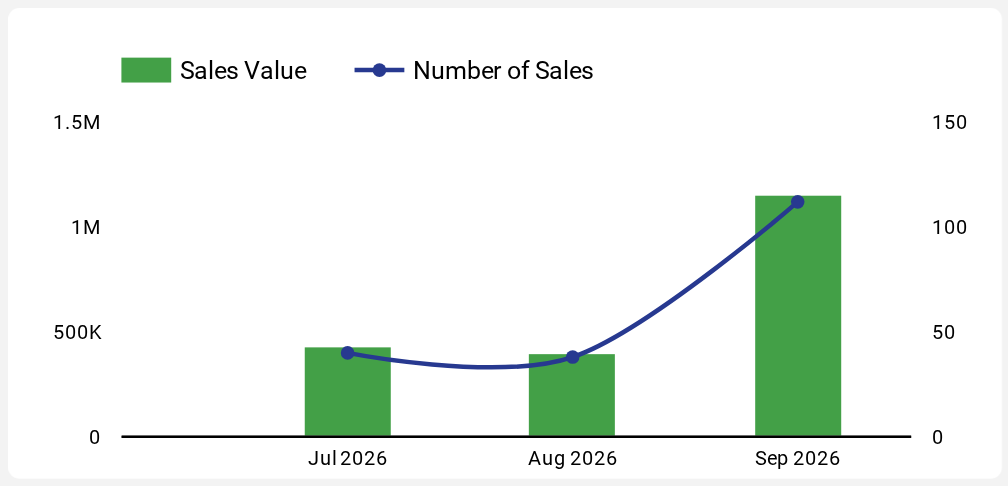
Month by month, the value sold (columns) and the number of sales (line).
- Pipeline / data model: Enriched deals model (table
rdm_deals) - Field(s) used:
closed_at(by month),total_price,id - Aggregation: Sum and count
Average Ticket (monthly) (Line chart)
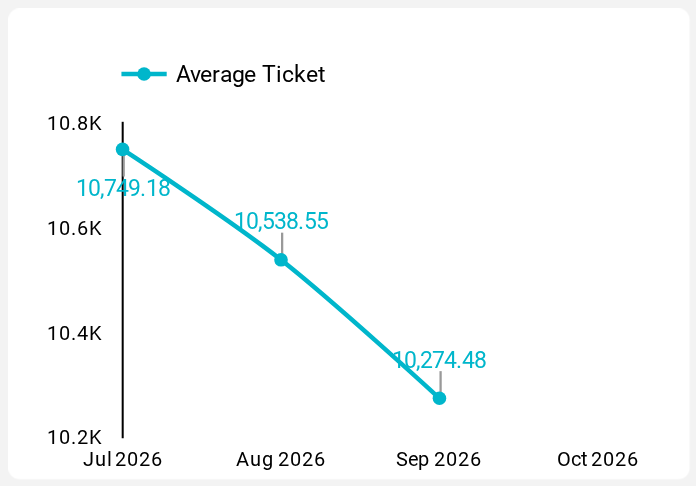
Average ticket over time, month by month.
- Pipeline / data model: Enriched deals model (table
rdm_deals) - Field(s) used:
closed_at(by month),total_price - Aggregation: Average
Average Cycle (Days) (Line chart)
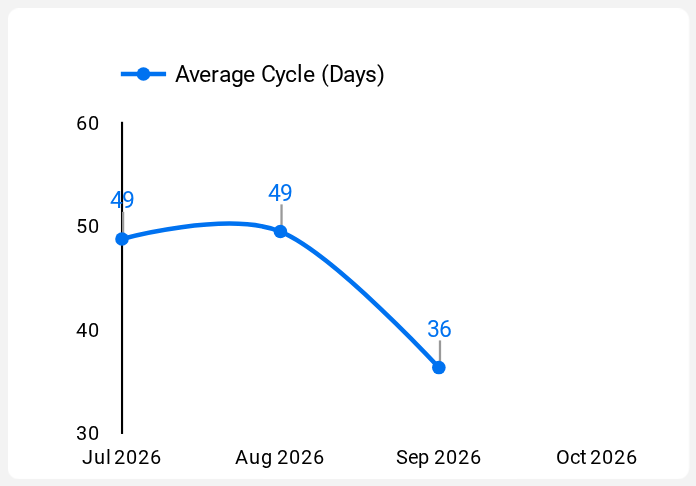
Sales cycle over time, month by month — whether sales are closing faster or slower.
- Pipeline / data model: Enriched deals model (table
rdm_deals) - Field(s) used:
created_atandclosed_at - Aggregation: Average of days
Win Rate among Closed Deals (Line chart)
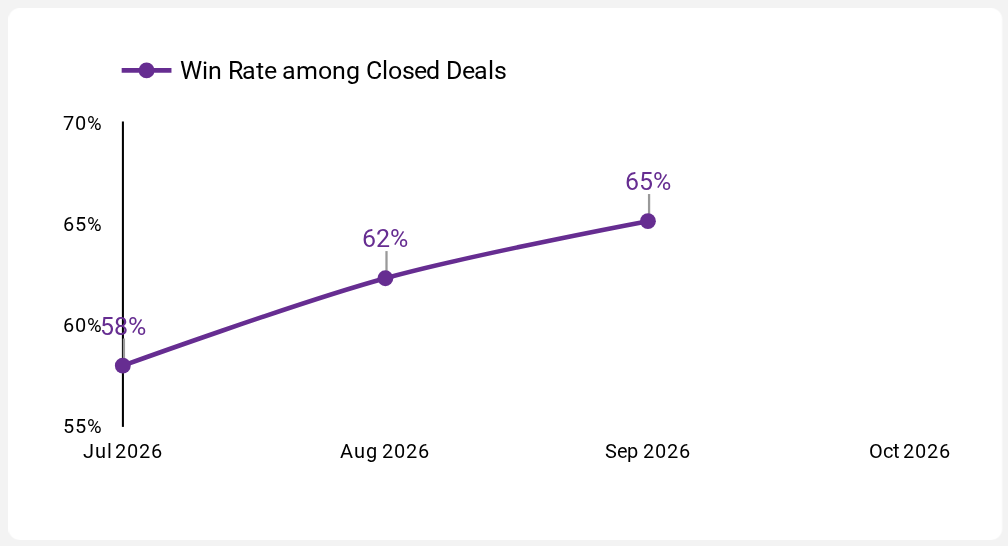
By closing month: of the deals closed in the month (won + lost), how many were won.
- Pipeline / data model: Enriched deals model (table
rdm_deals) - Field(s) used:
closed_at(by month),status - Aggregation: Won ÷ closed, as %
Sales (Table)
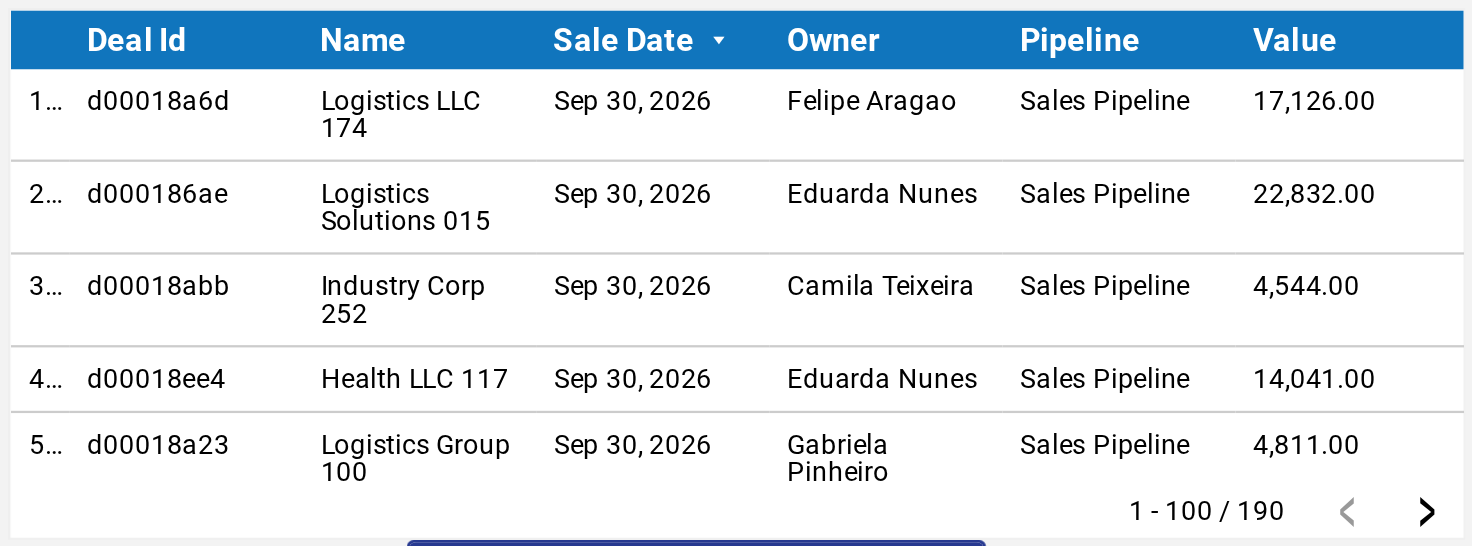
One row per sale in the period: Deal Id, Name, Sale Date, Owner, Pipeline and Value.
- Pipeline / data model: Enriched deals model (table
rdm_deals) - Field(s) used:
id,name,closed_at,user_name,deal_stage_pipeline_name,total_price
Calculated Fields
These are the fields calculated in Looker Studio from the pipeline and model fields. None of them requires a query written by you — they come ready in your copy of the report.
| Field | What it does | Used in |
|---|---|---|
| Status | Translates the deal status: won → Won, lost → Lost, paused → Paused, anything else → In Progress. | Status filter and column (Deals List); Won/Lost cards. |
| Won / Lost / In Progress / Paused deals | Count deals by status. | Cards and Deals by Status chart (Deals). |
| Sale date | The deal's closed_at when it was won (empty otherwise). It is the date used across the Sales page. | Sales page. |
| Won opportunities (filter) | Keeps only deals that have a sale date (that is, won deals). | Sales Value, Average Ticket, Average Cycle and the value, ticket and cycle charts (Sales). |
| Average Cycle | Average days between created_at and the sale date. | Average Cycle card and chart (Sales). |
| Win Rate | Won deals ÷ deals closed in the closing month. | Win Rate chart (Sales). |
| Task Status | canceled → Canceled; with completed_at → Completed; open with due_date before today → Overdue; otherwise → On Time. | Task Status filter, cards and column (Tasks List). |
| Overdue / On Time | Tasks neither canceled nor completed, with due_date before today (Overdue) or today/future (On Time). | Cards (Tasks). |
| Overdue / On Time / Canceled (chart) | Overdue = completed after the due date or open and past due; Canceled = status canceled; the rest = On Time. | 100% chart (Tasks). |
| Next Task | Earliest due_date among the deal's not-yet-completed tasks; empty if the deal is already closed (closed_at filled). | Table (Deals List). |
| Next Task Status | Closed deal → Deal Closed; no next task → No Task Scheduled; next task before today → Overdue; otherwise → On Time. | Table (Deals List). |
| Completed Tasks (per deal) | How many of the deal's tasks have completed_at; empty when zero. | Table (Deals List). |
| Response Time | Days between the deal's created_at and its first completed task; if there is none, days until today (in the weekly chart, a closed deal with no task counts until closed_at). | Response Time card and chart (Tasks). |
| Average Tasks per Deal | Average number of tasks per deal, counting zero for deals with no task. | Card and Tasks per Deal chart (Tasks). |
| Deal Coverage | Deals with at least one task ÷ total deals. | Card (Tasks). |
Joins inside Looker Studio: the Deals List, Tasks and Tasks List pages use joins between the tasks table and the deals model (by deal_id = id). In a join, the date range control filters by the date of the main side: task date in task views, deal creation date in deal views.
Benefits of Analyzing This Data
- The whole funnel in one place. Created, won, lost, paused and in-progress deals, by pipeline, owner and stage — no CRM spreadsheet exports.
- Know why you lose. Lost reasons month by month show whether the problem is price, competitors or customer fit — and where to act.
- Follow-up backed by data. Response time, coverage and overdue tasks show which opportunities are cooling down without contact.
- Act on the right deal. The Deals List points to deals with no next task or with an overdue task.
- Track the outcome. Value sold, average ticket, sales cycle and win rate month by month, compared to the previous period.
- Automatic updates, no code. Kondado's pipelines and models keep the report up to date; you don't write or maintain any query.
How to use the RD Station CRM report in Looker Studio
Step by step to create the RD Station CRM report with your own data and navigate its 5 pages.
Start from the Use your own data button
Click Use your own data at the top of the article and sign in to your Kondado account.
Connect RD Station CRM
Authorize your RD Station CRM account in Kondado's data source.
Wait for the initial load
Kondado creates 7 pipelines and 2 models and loads deals and tasks from the last 90 days.
Create your copy of the report
At the end of the flow, use the link to create your copy in Looker Studio, already connected to your data.
Navigate the pages
Use the side menu to see Deals, Deals List, Tasks, Tasks List and Sales, filtering by owner, sales pipeline and period.