
With over 2 billion active users, Instagram is one of the most powerful platforms for brands, agencies, and businesses of all sizes. But real results take more than likes - they take a clear read of your Instagram metrics: follower growth, reach, engagement per format, and which hashtags actually convert.
A complete Instagram report covers followers, reach, impressions, engagement per format (Reels, Feed, Stories), and hashtag trends. You can build it manually, send the data to an analytics report in Looker Studio or Power BI, or use a Kondado report template that connects the Instagram Business data source and keeps the report fresh at the frequency you choose. The same data also answers questions in ChatGPT and Claude through Kondado's MCP server (endpoint https://mcp.kondado.io/mcp).
Must-have metrics for your Instagram report
We've selected a set of essential metrics to help you fully understand how your Instagram profile is performing:
1. General Insights
Start your report with an overview of key metrics such as followers, likes, shares, saves, and Reels plays.
2. New Followers Last 30 days Chart
A line chart that shows the follower growth over time, based on data automatically pulled from the data pipeline. It's useful for spotting trends, growth spikes or drops that deserve attention.
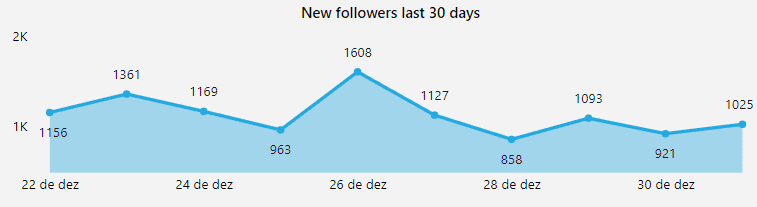
Image of Kondado's Instagram Report in Power BI
Why your follower history only covers the last 30 days
The Meta API only returns the daily follower total (follower_count) for roughly the last 30 days. That's why Instagram Insights never shows long-term follower history.
- Kondado stores every replicated day in your Via Kondado (savepoint), so your follower history keeps growing even where the Meta API no longer returns the value.
- When Meta hits its recurring
follower_count = 0bug (as in March 2026), Kondado keeps the real number from the profile snapshot (followers_countininstagram_profiles), so you don't think you lost followers overnight. - Accounts with fewer than 100 followers don't get
follower_countfrom Meta - that's a documented API limit, not a report failure.
3. Outreach Funnel Chart
Visualize your reach journey — from impressions to profile reach to new followers. Great for analyzing how well your content converts exposure into growth.
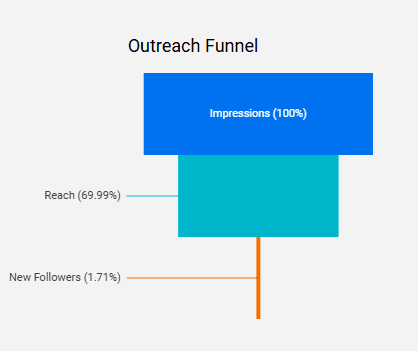
Image of Kondado's Instagram Report in Looker Studio
4. Reach x New Followers Chart
Compare how many people you reached versus how many started following you during the same time period. This reveals whether your content is not just being seen — but actually converting.
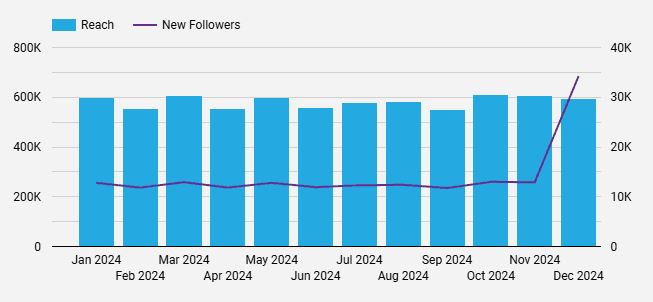
Image of Kondado's Instagram Report in Looker Studio
5. Hashtag Trends Word Cloud Chart
Highlights the hashtags from your most-liked posts, helping you identify trends and the most relevant topics on your profile.
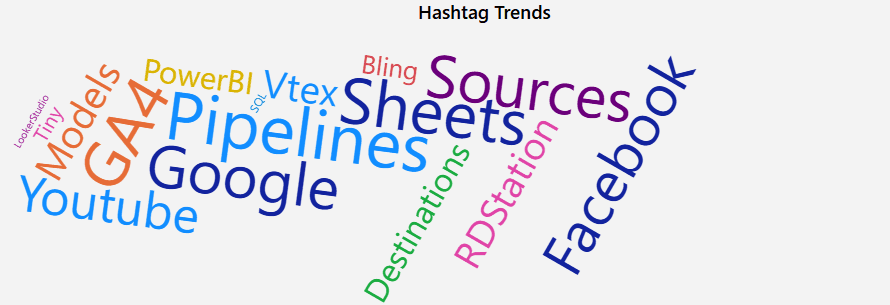
Image of Kondado's Instagram Report in Power BI
6. Performance Table
A detailed view of your posts along with their respective metrics (likes, comments, saves, reach, impressions, etc.). This table is great for comparing the performance of different content formats and topics.
It also helps identify which traffic sources bring the most visits based on session volume, allowing you to fine-tune your audience acquisition strategies.
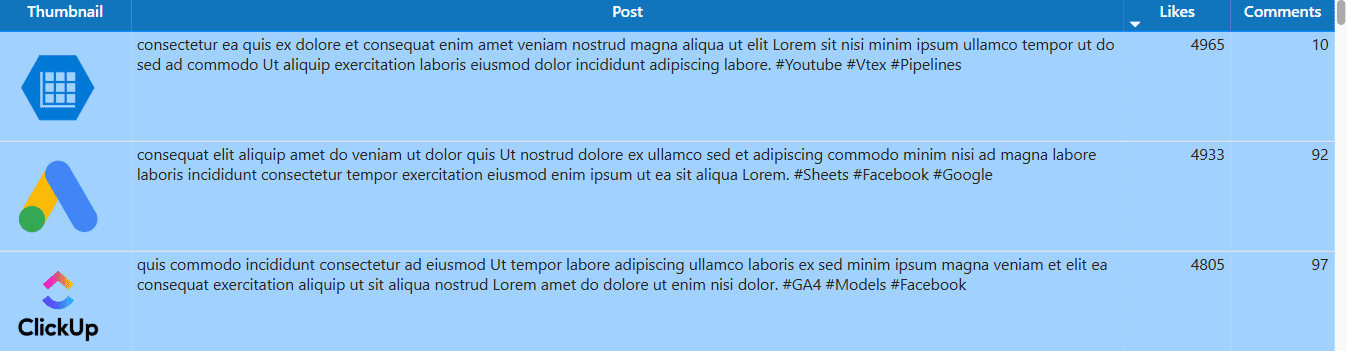
Image of Kondado's Instagram Report in Power BI
Engagement vs reach: not the same thing
Engagement and reach measure different things, and mixing them up distorts the report.
- Reach (
reach) is how many unique accounts saw the content. - Engagement is how many interacted (likes, comments, saves, shares).
- For a real organic engagement rate, divide
total_interactionsbyreach, so the metric doesn't inflate as your follower base grows. - The correct field is
total_interactions, which replaced the oldengagementfield (deprecated by Meta in 2023). Reports still summing the old field silently return zero.
How to build your Instagram report
You can build your report in three ways, depending on your goals and tools available:
1. Manually
Export data from Instagram (via Meta Business Suite or Insights) and manually organize it in spreadsheets or presentations. It's a good option for one-off reports, but it can be time-consuming and limited in flexibility.
2. Using Kondado
With Kondado, you can automate your Instagram report by replicating your account data to:
- Spreadsheets in Excel or Google Sheets
- BI tools like Looker Studio and Power BI
- Databases such as MySQL and Redshift
This way, you can build customized reports without any coding, with automatic updates and interactive visualizations.
3. Using Kondado’s ready-to-use templates
If you're looking for convenience, Kondado offers ready-to-use, customizable Instagram report templates with all key metrics already set up. Just connect your data and you're all set: a complete report in just a few minutes.
Track your Instagram with Kondado's automation
Query your Instagram metrics in natural language with ChatGPT (via MCP)
The same data that powers your report also answers questions in ChatGPT and Claude. Once Kondado replicates your Instagram Business data into your Via Kondado, Kondado's MCP server (endpoint https://mcp.kondado.io/mcp) lets ChatGPT and Claude query those tables in KSQL and answer in plain English - no CSV export, no screenshots, no spreadsheet.
Example questions you can ask right in the chat:
- "Compare average
total_interactionsacross Reels, Feed, and Stories over the last 90 days - which format drives the most engagement per post?" - "Show the daily follower curve for the last 6 months and ignore the days zeroed out by the March 2026 Meta bug."
Want the full setup walkthrough? See how to analyze Instagram data with ChatGPT.
Conclusion
A well-structured Instagram report is essential for anyone who wants to grow with strategy and consistency. Focus on the right metrics, automate the data collection with Kondado, and you gain time, clarity, and decision-making power.
Start your free 14-day trial and build your Instagram analytics report template today.
Build an Instagram Report
Pick the metrics that matter for Instagram and assemble them in a spreadsheet or BI tool, with Kondado loading the data automatically.
Define your core metrics
List the metrics that drive your decisions: followers, likes, shares, saves, Reels plays, new followers in the last 30 days, an outreach funnel, reach vs. new followers, hashtag trends, and a per-post performance table.
Choose how to source the data
Decide between manual CSV exports from Instagram Insights or automated pipelines via Kondado, which loads Instagram data into spreadsheets, BI tools, or databases on a schedule you choose.
Pick the right destination
Send the data to Google Sheets or Excel for spreadsheet reporting, to Looker Studio or Power BI for dashboards, or to MySQL / Redshift for deeper modelling.
Assemble visuals and filters
Build line charts for follower growth, funnels for reach → followers, word clouds for hashtags, and a sortable table with per-post metrics. Add filters by post type and date range.
Use a ready-made template to skip setup
Skip the build by starting from Kondado's Instagram report templates for Looker Studio or Power BI and connect your Instagram account.