In a market where competition is high and time is short, relying on data that’s both reliable and easy to interpret can make a real difference. That’s why Power BI has become one of the most widely used tools for businesses that need speed and clarity in their decision-making processes.
With Power BI, you can create interactive reports that bring together key information from areas like sales, customer behavior, and financial performance.
In this article, you’ll explore report templates in Power BI designed to help you better understand your sales and customers.
What is Power BI?
Why use reports?
Reports help make sense of your data by bringing everything into a single, organized visual panel. They make it easier to track business performance and quickly respond to changes.
We’ve developed several Power BI report templates, take a look at some examples below:
Customer report in Power BI
Understanding your customer behavior is just as important as tracking your sales. Below are examples of report focused on customer insights:
- VTEX report in Power BI
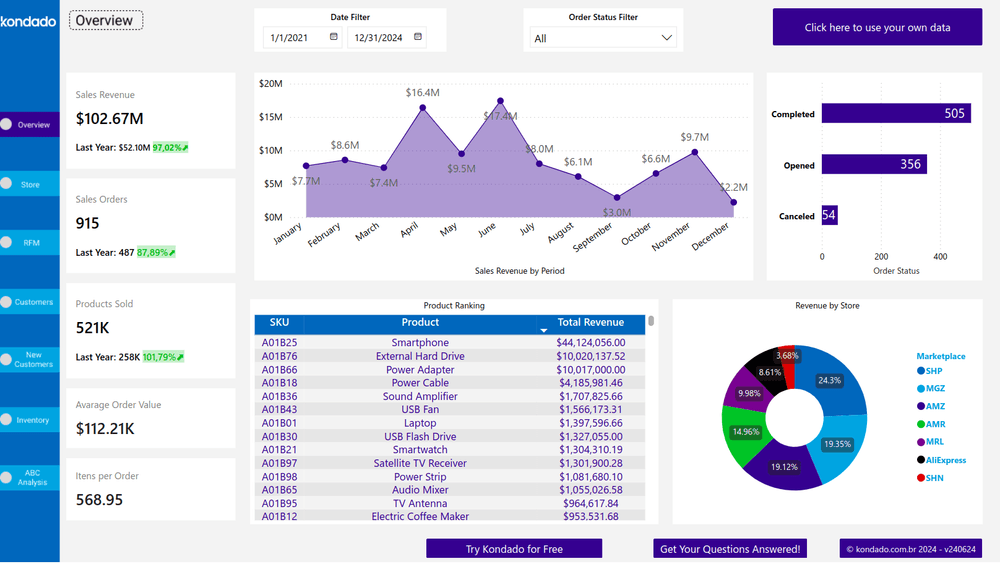
The Customer page in this report displays data like revenue by state and city, revenue per customer, number of active customers during a period, and the number of served regions and cities. You can also apply filters by order status, date range, and number of cities served.
Marketing reports in Power BI
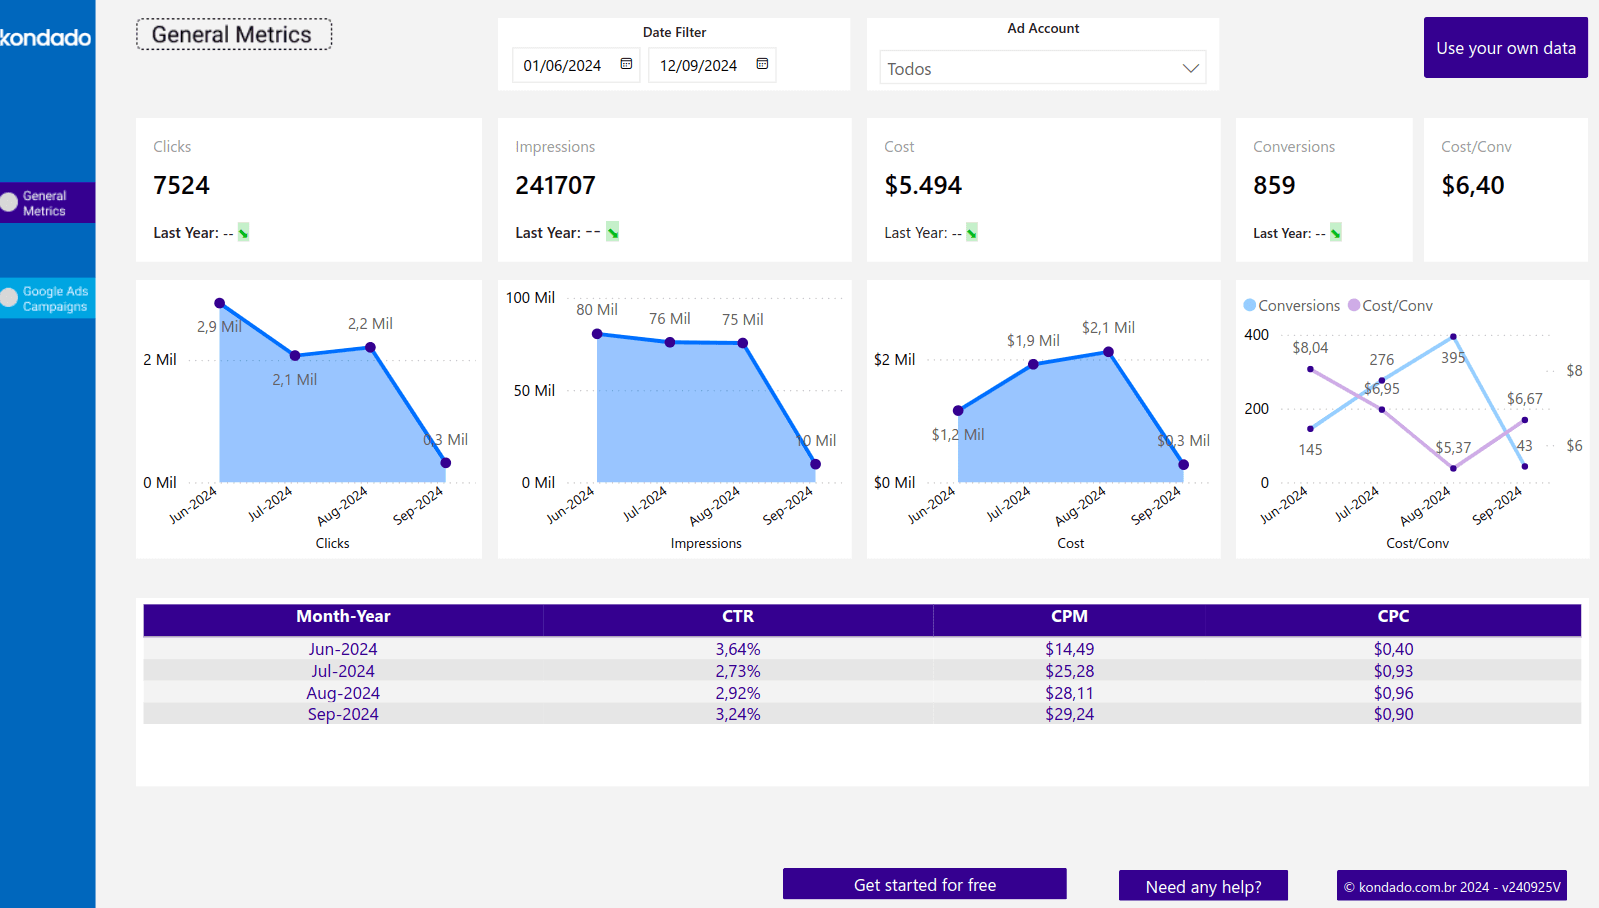
- Google Ads report in Power BI
This template shows key advertising metrics like clicks, impressions, and CPM. It also includes filters for ad account, campaign name, and date.
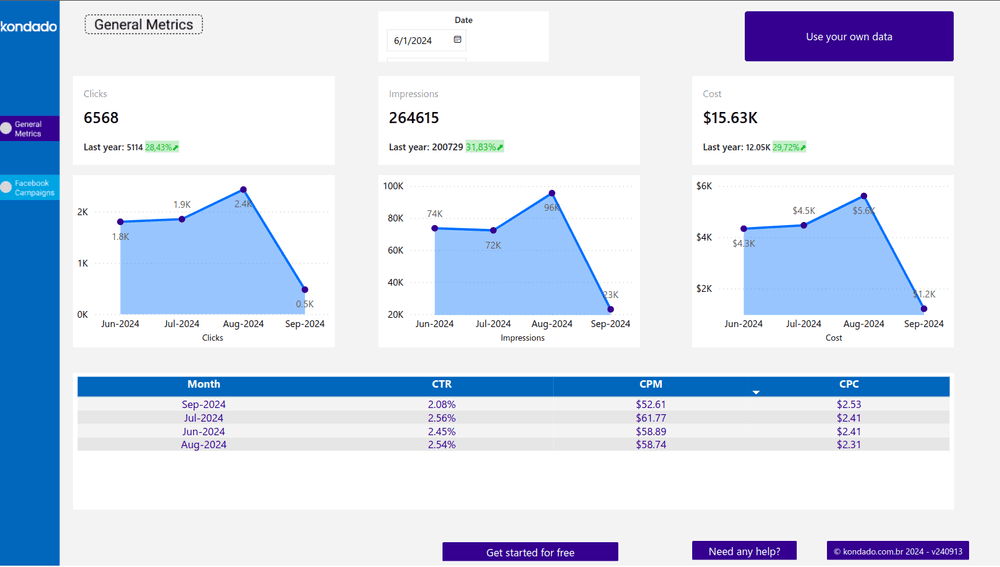
- Facebook Ads report in Power BI
This report offers in-depth analysis of metrics like clicks, costs, impressions, CTR, and more. You can view performance by day, week, month, or year.
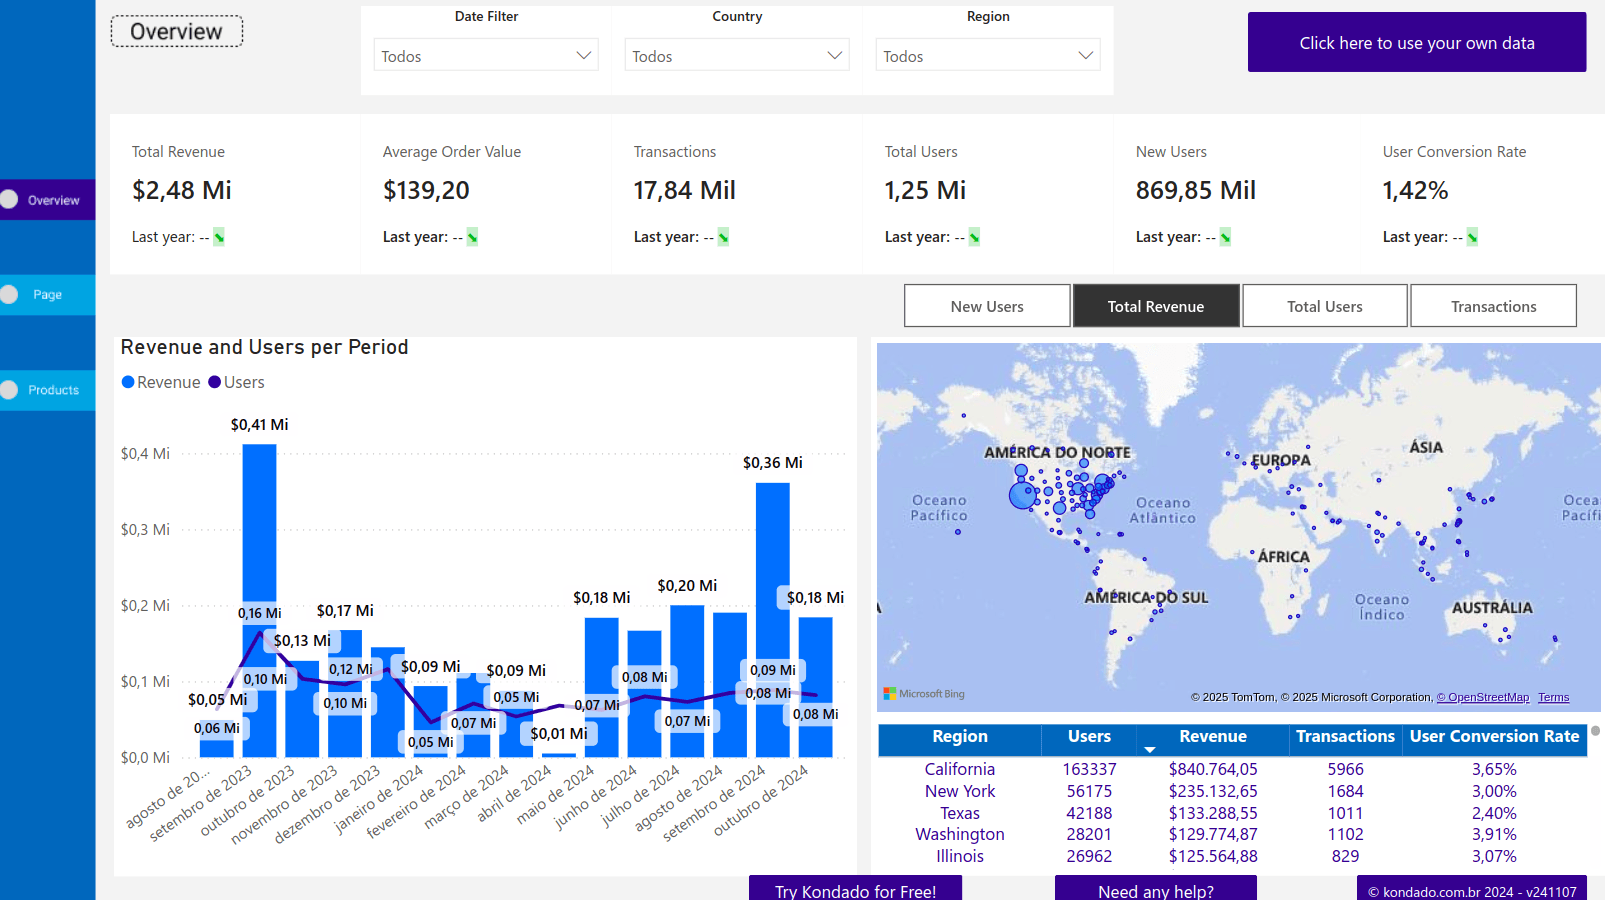
- Google Analytics (GA4) report in Power BI
This report is organized into three sections: Overview, Pages, and Products. The Overview page gives you an overall view of key metrics and insights. You can apply filters by date range, country, and region, and also compare performance with the same period from the previous year.
On the Pages tab, you’ll find a breakdown of your sales funnel along with a detailed analysis of how users interact with your site. It includes data on sessions, traffic sources, media types, channel groups, and campaigns.
Finally, the Products tab helps you spot your most profitable items and optimize your product portfolio using an ABC Curve table and chart. You’ll also see data such as revenue, page views, and conversion rates.
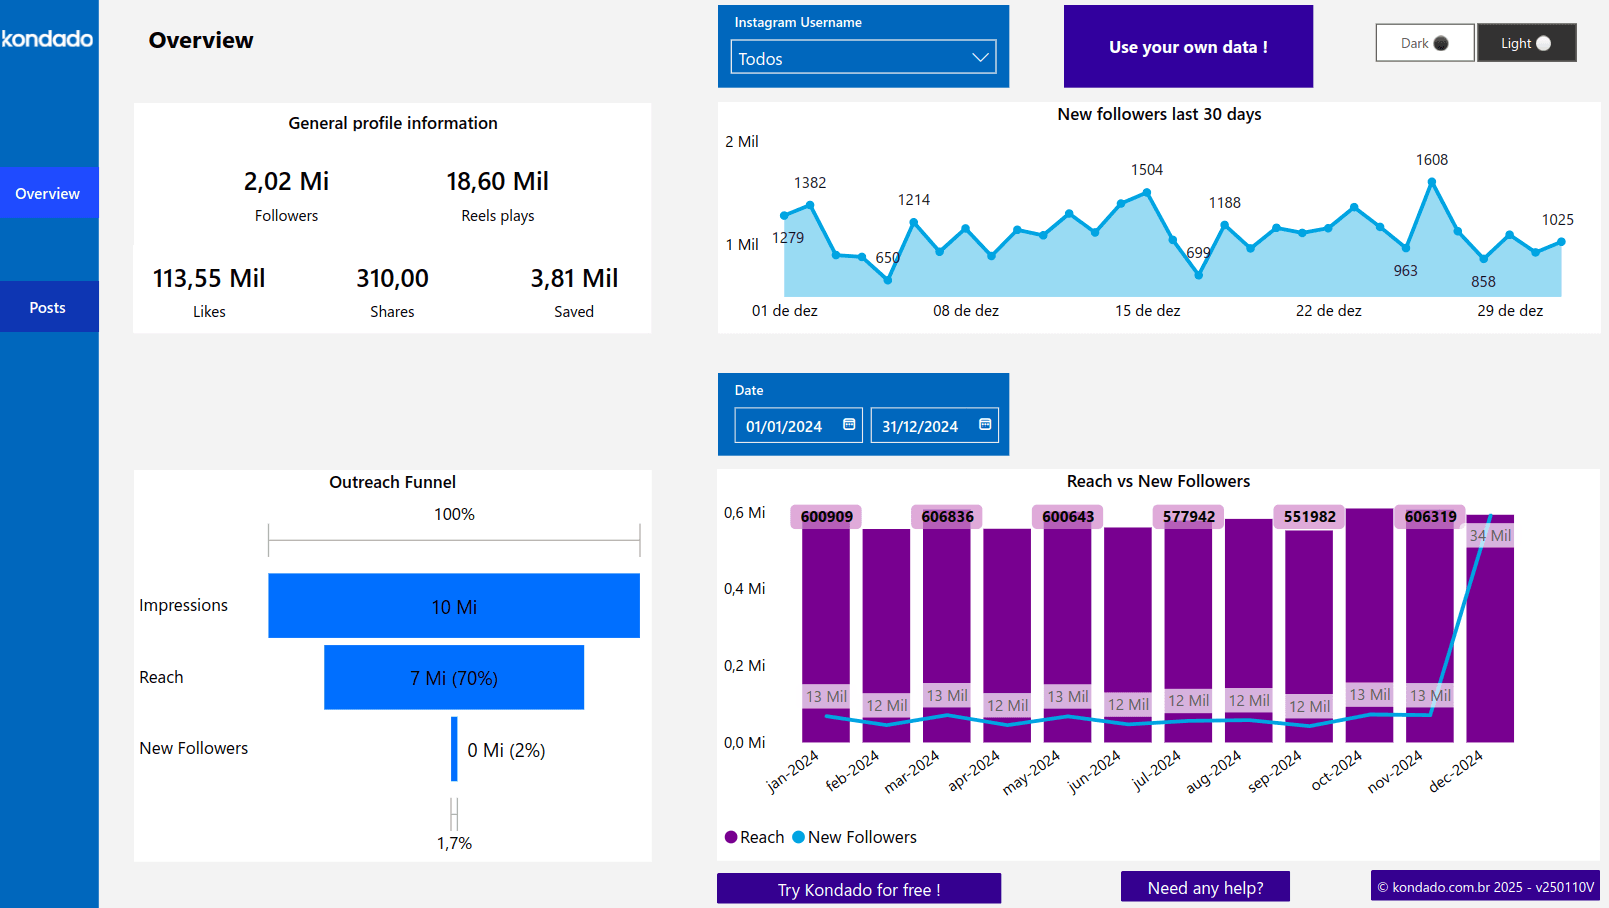
- Instagram report in Power BI
Track follower growth over the last 30 days and dive into audience engagement insights. It includes monthly metrics on reach and new followers, post-level stats like likes and comments, filters by post type, engagement-driving hashtags, and performance trends across Overview and Post pages.
Free Power BI Templates
Looking for free Power BI templates you can put into production today? With Kondado, you get a curated pack of free Power BI report templates that connect directly to 80+ data sources and refresh automatically — no scratch builds, no third-party paywalls, no spreadsheet exports.
Each template below is a ready-to-use Power BI report with pre-built visuals, filters, and metrics. After you sign in to Kondado and replicate your data with a few clicks, the report renders against live values from your own account.
The 2026 free Power BI report template pack
- Bling — free Power BI report template — sales orders, financial entries, products, stock levels, and customer data from Bling ERP.
- Conta Azul — free Power BI report template — revenue, accounts payable, accounts receivable, and DRE structure for Conta Azul ERP.
- Omie — free Power BI report template — orders, finance, accounts, and product performance from Omie ERP.
- Tiny ERP — free Power BI report template — sales, stock, and order analytics from Tiny ERP.
- VTEX — free Power BI report template — revenue by region, customer cohorts, and order status for VTEX e-commerce.
- Mercado Libre — free Power BI report template — orders, ads, fees, customers, and inventory in one Power BI report.
- Meta Ads — free Power BI report template — Facebook and Instagram paid performance, including spend, CTR, and ROAS.
- Google Analytics 4 — free Power BI report template — sessions, traffic sources, page performance, and product analysis from GA4.
- Instagram — free Power BI report template — follower growth, post engagement, and hashtag performance from Instagram organic.
- RD Station Marketing — free Power BI report template — landing page, email, and lead generation analytics from RD Station Marketing.
- RD Station CRM — free Power BI report template — pipeline stages, deal velocity, and sales team performance from RD Station CRM.
How to use the free Power BI templates
Every template in the pack pairs with a Kondado data source. The flow is the same on all of them: connect the source in Kondado, choose Power BI as the destination, and import the matching .pbix file into Power BI Desktop. From that point on, the report stays current — Kondado replicates new data on the cadence you choose, and Power BI refreshes against it.
The full set of available templates, including the Looker Studio versions of the same reports, lives on the Kondado free report templates hub. To configure Power BI as a destination for the first time, follow the Power BI via Kondado guide in the Kondado Wiki.