Ready-to-use and customizable reports for Tiny ERP
Get started for free
No credit card required | 14 days | 10 million records | 30 pipelines


or sign up with your email
By signing up, you agree to Kondado’s Terms of service and Privacy policy


Tiny ERP Dashboard Templates: Ready in Minutes
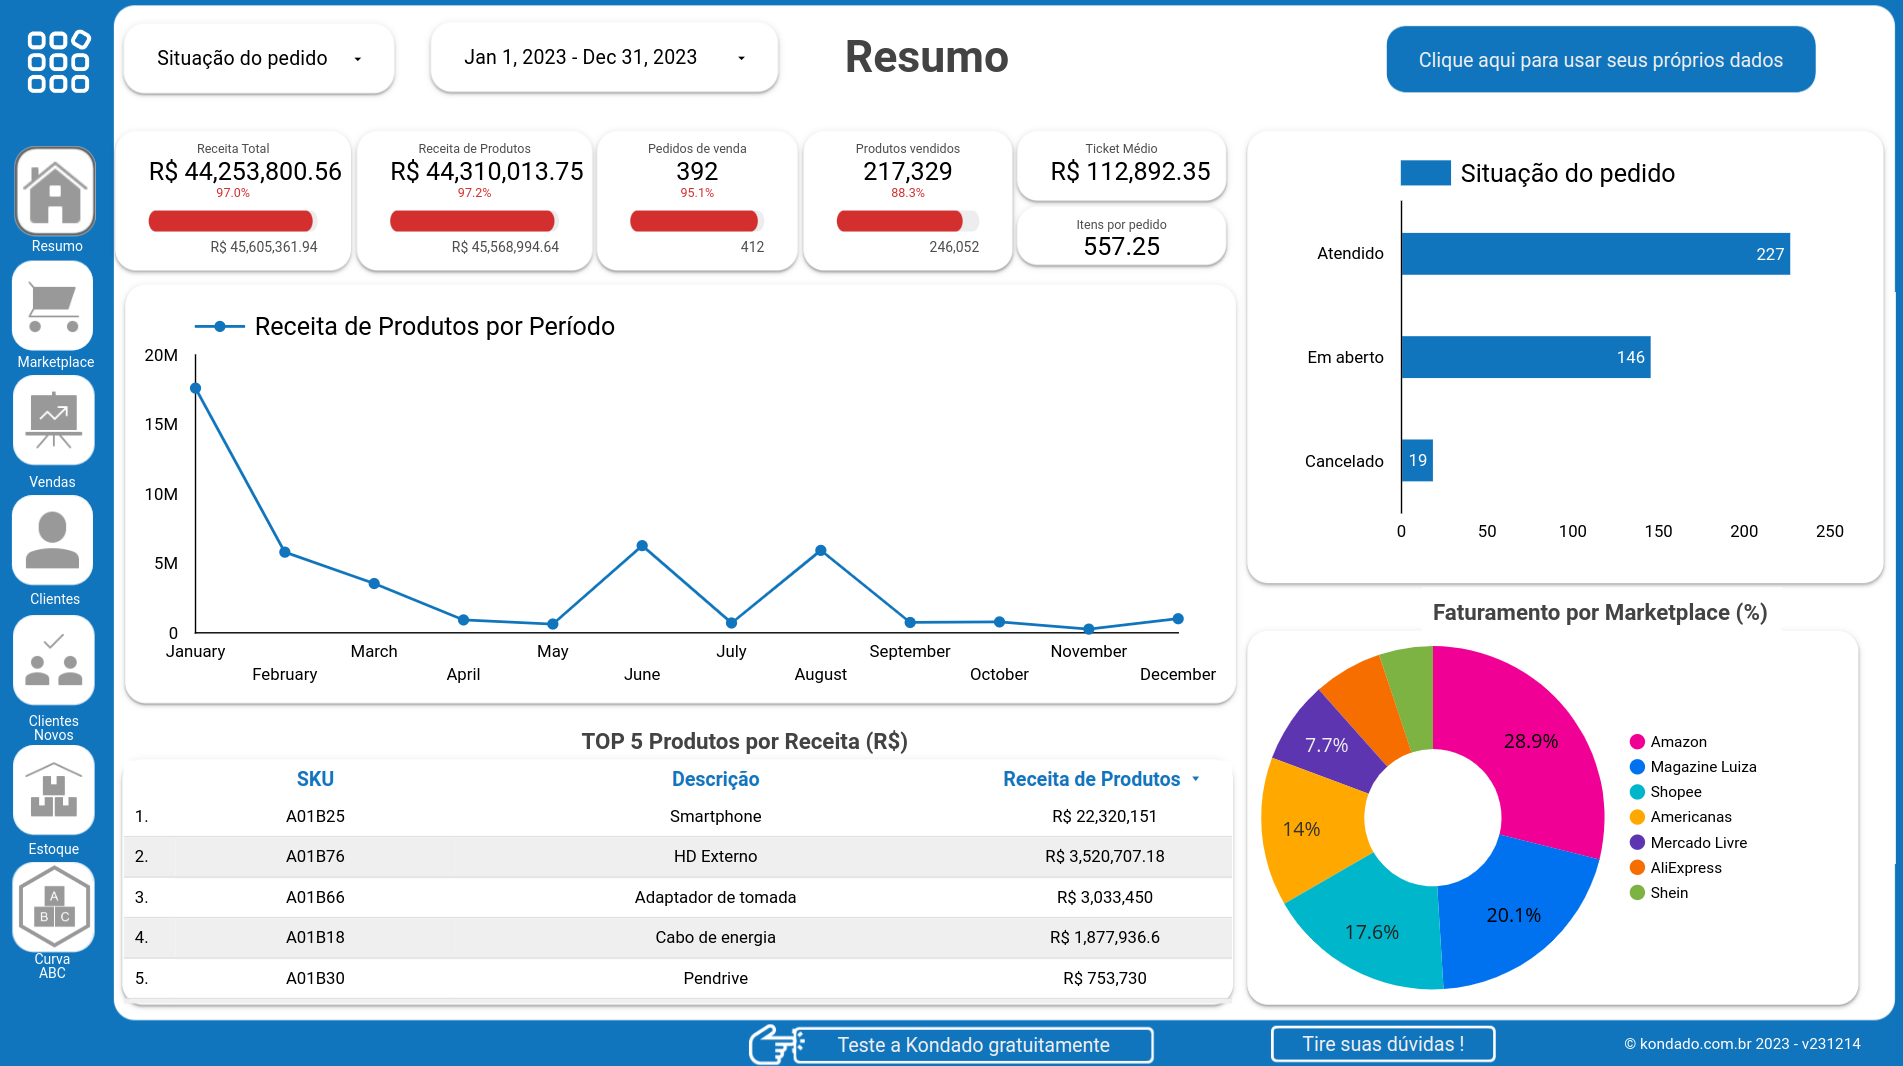
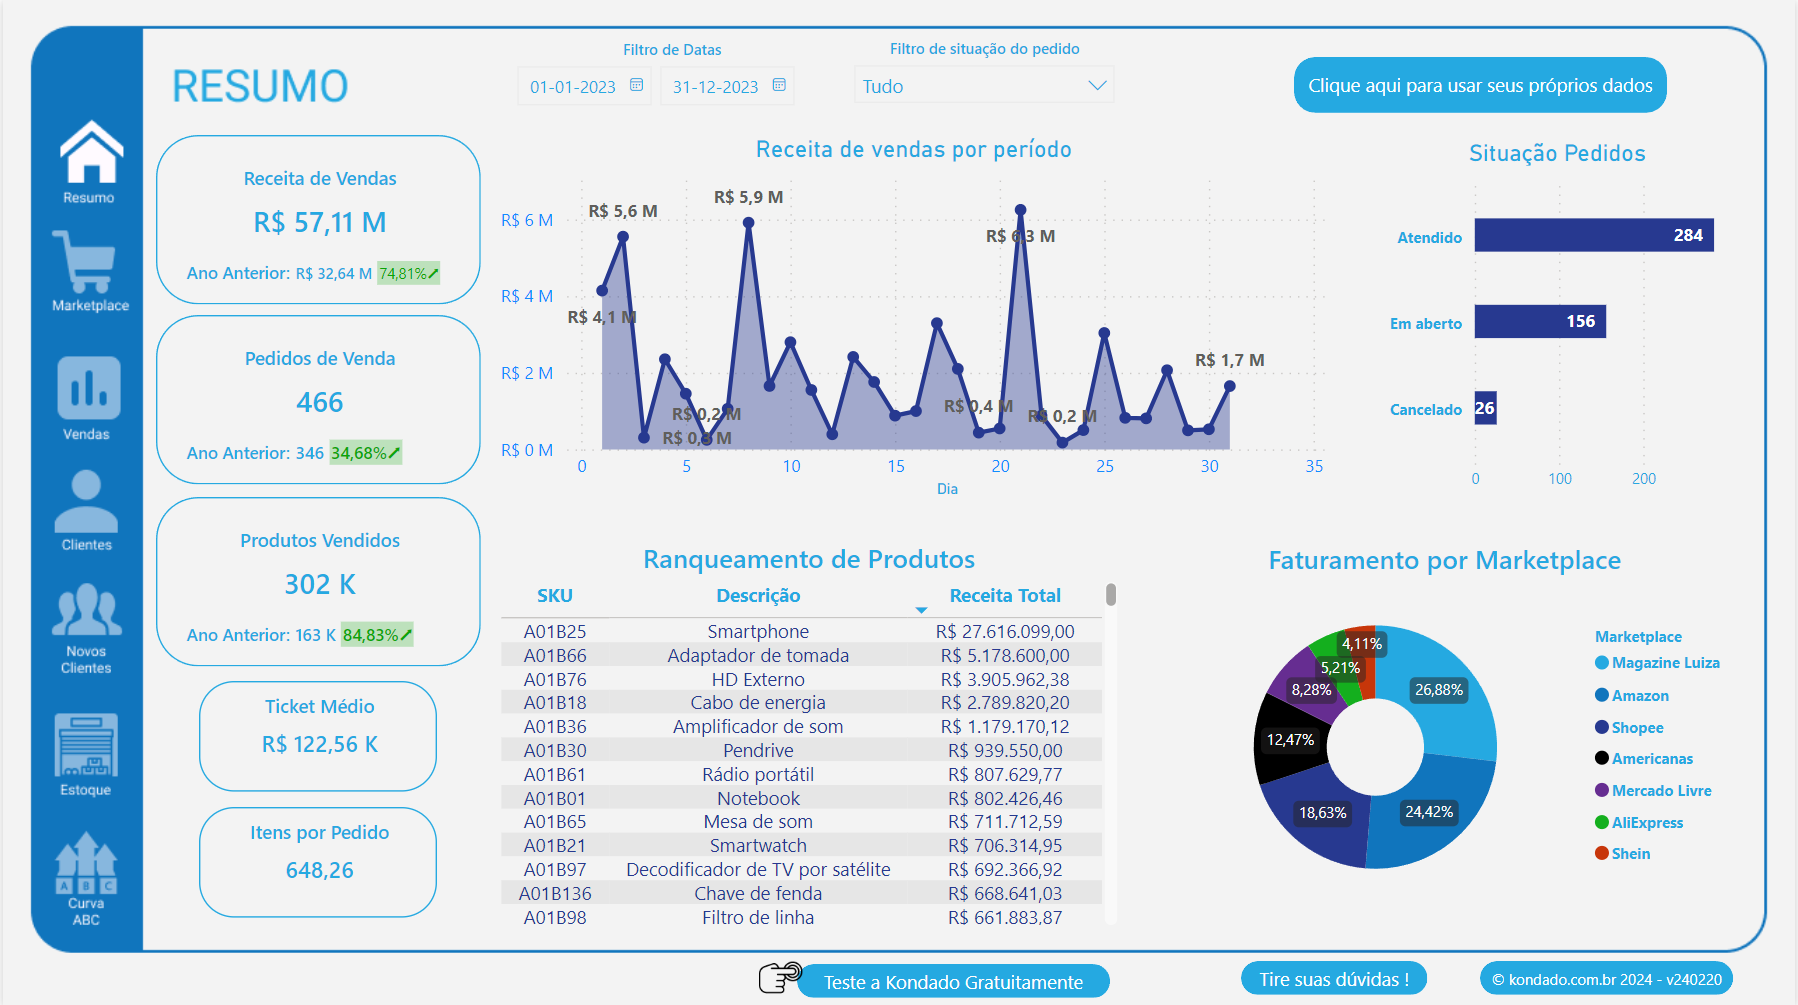
Tiny ERP serves as the operational backbone for online stores, retail chains, and service businesses managing inventory, financial payments, and multi-channel sales across various digital channels. Kondado transforms this complex operational data into immediate visual insights through specialized report templates built specifically for Tiny ERP users and their analytical needs. Business teams can deploy these dashboards to track ecommerce performance, monitor payment flows, and analyze operational KPIs without writing code or manually configuring data structures.
Kondado offers two pre-built report templates for Tiny ERP: the Olist Tiny Looker Studio Report and the Olist Tiny Power BI Report. These templates include pre-configured pipelines for ecommerce marketplaces, financial payments, and ERP management data, enabling deployment of complete dashboards within minutes through simple account authentication and tool selection.
Check out the reports for Tiny ERP in Looker Studio and Power BI
Try out all the features for free for 14 days
Hundreds of data-driven companies trust Kondado


Why Kondado?
Focus on extracting value from your data and leave the rest to us
'%3E%3Cpath d='M51,41a9.978,9.978,0,0,0-7.857,3.835L22.648,34.588a9.69,9.69,0,0,0,0-5.176l20.5-10.247a10.1,10.1,0,1,0-1.791-3.577L20.857,25.835a10,10,0,1,0,0,12.33L41.352,48.412A9.994,9.994,0,1,0,51,41Z' fill='%23383e51'%3E%3C/path%3E%3C/g%3E%3C/svg%3E)
'%3E%3Cpath d='M33,47.645V60.71c.024-.014.05-.018.073-.033l11-7A2,2,0,0,0,45,51.992V40.012Z' fill='%23383e51'%3E%3C/path%3E%3Cpath d='M31,47.645,19,40.011V51.992a2,2,0,0,0,.927,1.688l11,7c.023.015.049.019.073.033Z' fill='%23383e51'%3E%3C/path%3E%3Cpath d='M32,21.693l12-7.634L33.076,7.086a2,2,0,0,0-2.152,0L20,14.059Z' fill='%23383e51'%3E%3C/path%3E%3Cpath d='M12,35.556,0,27.922V39.9A2,2,0,0,0,.927,41.59l11,7c.023.014.049.019.073.033Z' fill='%23383e51' data-color='color-2'%3E%3C/path%3E%3Cpath d='M52,35.556l12-7.634V39.9a2,2,0,0,1-.927,1.687l-11,7c-.023.014-.049.019-.073.033Z' fill='%23383e51' data-color='color-2'%3E%3C/path%3E%3Cpath d='M47,38.914a2,2,0,0,0-.924-1.686L38,32.074V27.922l12,7.634V48.621c-.024-.014-.05-.019-.073-.033L47,46.726Z' fill='%23383e51' data-color='color-2'%3E%3C/path%3E%3Cpath d='M13,33.821l12-7.634L14.076,19.214a2,2,0,0,0-2.152,0L1,26.187Z' fill='%23383e51' data-color='color-2'%3E%3C/path%3E%3Cpath d='M17,38.914a2,2,0,0,1,.924-1.686L26,32.074V27.922L14,35.556V48.621c.024-.014.05-.019.073-.033L17,46.726Z' fill='%23383e51' data-color='color-2'%3E%3C/path%3E%3Cpath d='M32,45.91l12-7.634L33.076,31.3a2,2,0,0,0-2.152,0L20,38.276Z' fill='%23383e51'%3E%3C/path%3E%3Cpath d='M14.076,19.214a2,2,0,0,0-2.152,0L1,26.187l12,7.634,12-7.634Z' fill='%23383e51' data-color='color-2'%3E%3C/path%3E%3Cpath d='M49.924,19.214a2,2,0,0,1,2.152,0L63,26.187,51,33.821,39,26.187Z' fill='%23383e51' data-color='color-2'%3E%3C/path%3E%3Cpath d='M26,27.922,14,35.556V48.621c.024-.014.05-.019.073-.033L17,46.726V38.914a2,2,0,0,1,.924-1.686L26,32.074Z' fill='%23383e51' data-color='color-2'%3E%3C/path%3E%3Cpath d='M27.076,25.138A2,2,0,0,1,28,26.824V30.8l1.848-1.179A4,4,0,0,1,31,29.123V23.428L19,15.794v4.19Z' fill='%23383e51'%3E%3C/path%3E%3Cpath d='M36.924,25.138A2,2,0,0,0,36,26.824V30.8l-1.848-1.179A4,4,0,0,0,33,29.123V23.428l12-7.634v4.19Z' fill='%23383e51'%3E%3C/path%3E%3Cpath d='M33.076,31.3a2,2,0,0,0-2.152,0L20,38.276,32,45.91l12-7.634Z' fill='%23383e51'%3E%3C/path%3E%3C/g%3E%3C/svg%3E)
'%3E%3Cpath d='M50.348,42.573c0-9.411-8.691-12.336-16.348-14.416v-16.1a32.837,32.837,0,0,1,9.363,1.656l2.778,1.11,2.228-5.57L45.584,8.134A38.043,38.043,0,0,0,34,6.046V1H30V6.081c-8.213.594-16.348,4.86-16.348,13.471,0,9.036,8.841,11.732,16.348,13.744V50.074a33.591,33.591,0,0,1-12.006-2.511l-2.683-1.341-2.684,5.367,2.684,1.342c.243.121,5.7,2.792,14.689,3.152V63h4V56.065C44,55.462,50.348,50.3,50.348,42.573Zm-30.7-23.021c0-5.133,5.96-7.016,10.348-7.446V27.071C23.512,25.243,19.652,23.535,19.652,19.552ZM34,50.043V34.393c6.5,1.882,10.348,3.761,10.348,8.18C44.348,48.377,37.873,49.744,34,50.043Z' fill='%23383e51'%3E%3C/path%3E%3C/g%3E%3C/svg%3E)
Try out all the features for free for 14 days