No credit card required | 14 days | 10 million records | 30 pipelines
or sign up with your email
By signing up, you agree to Kondado’s Terms of service and Privacy policy
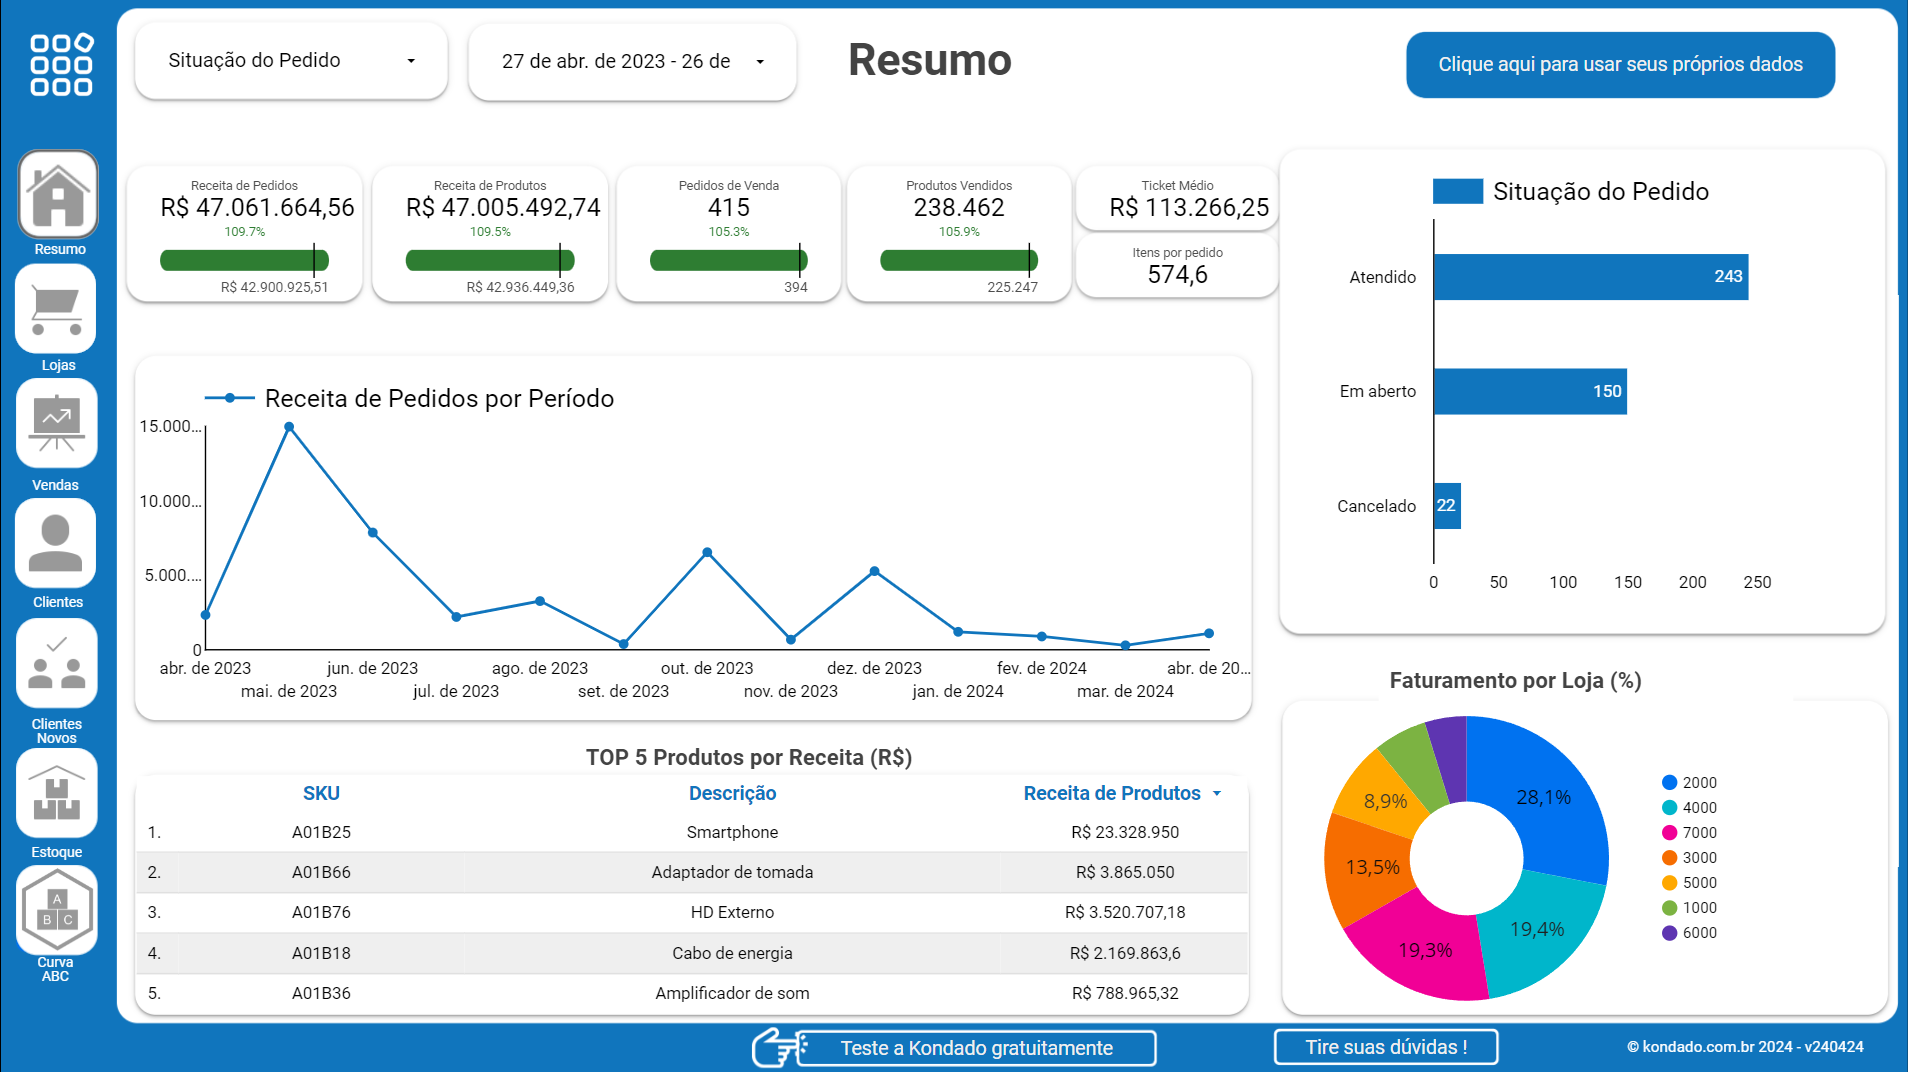
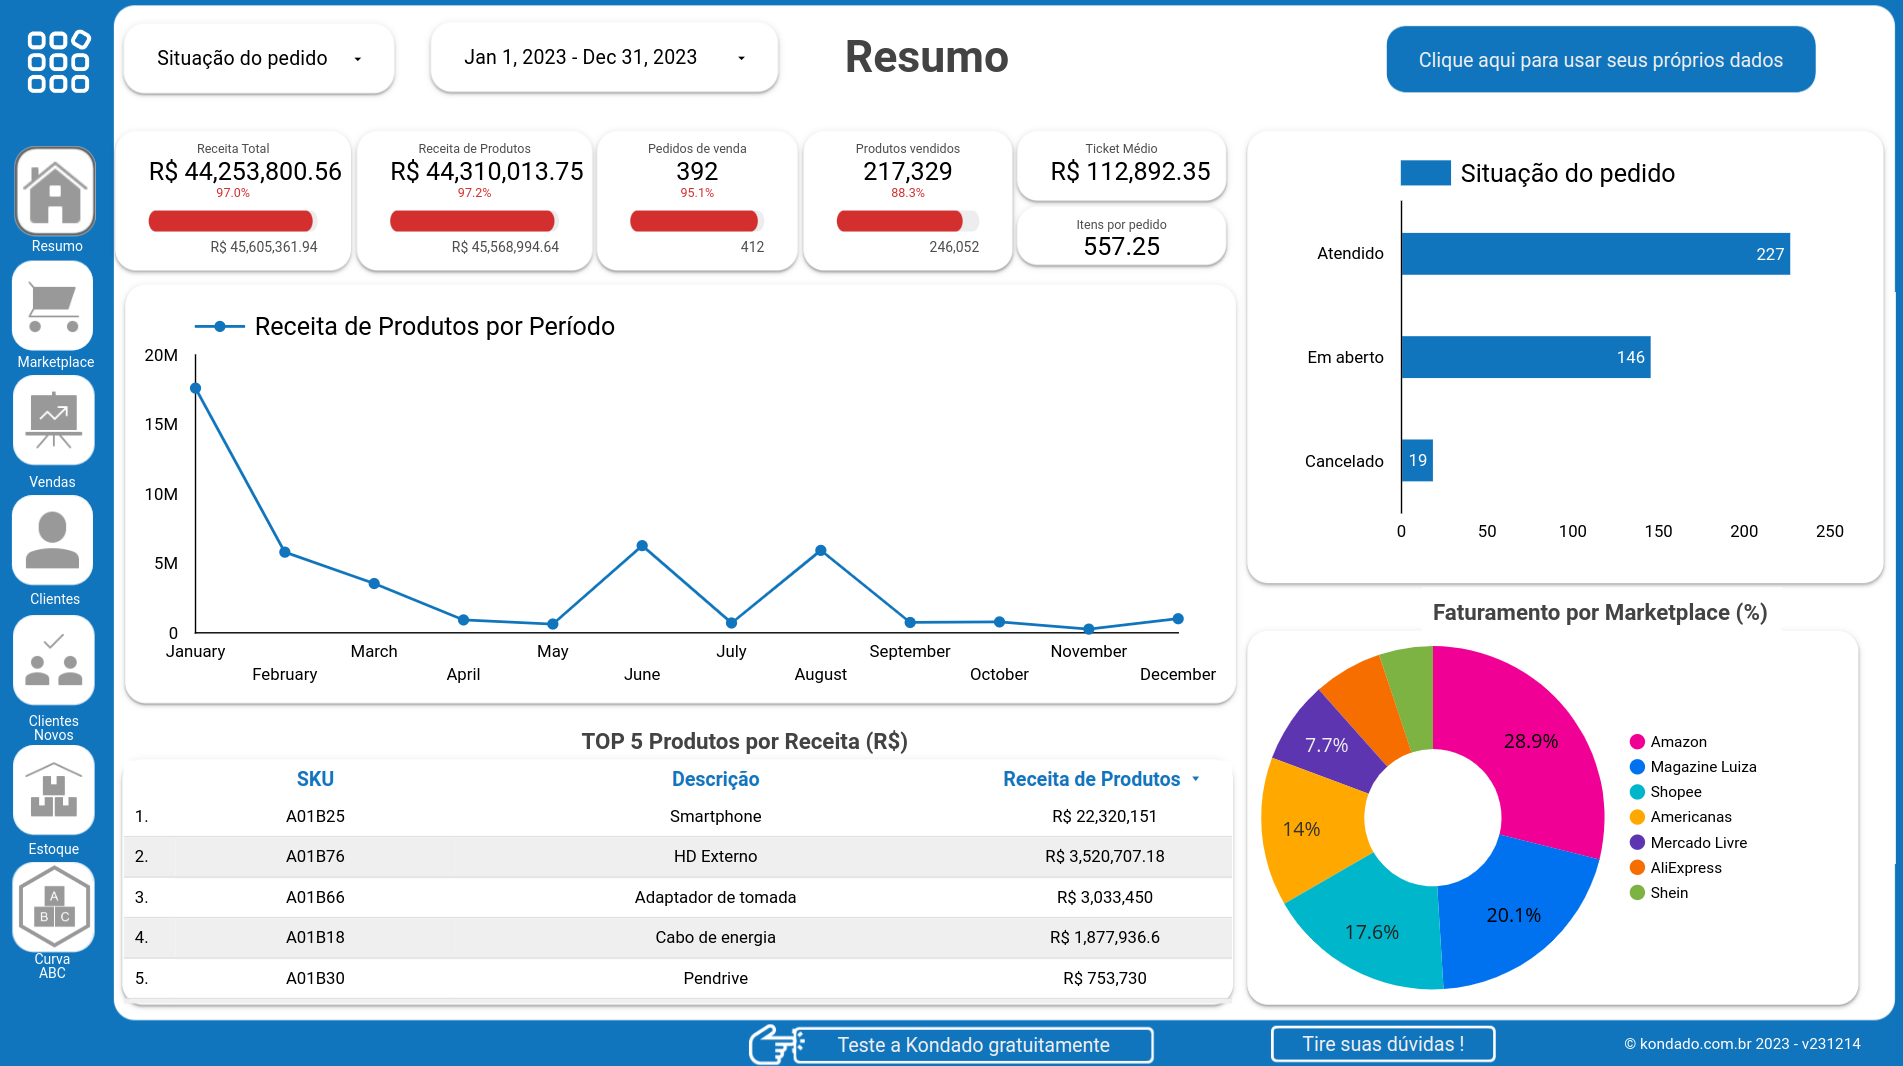
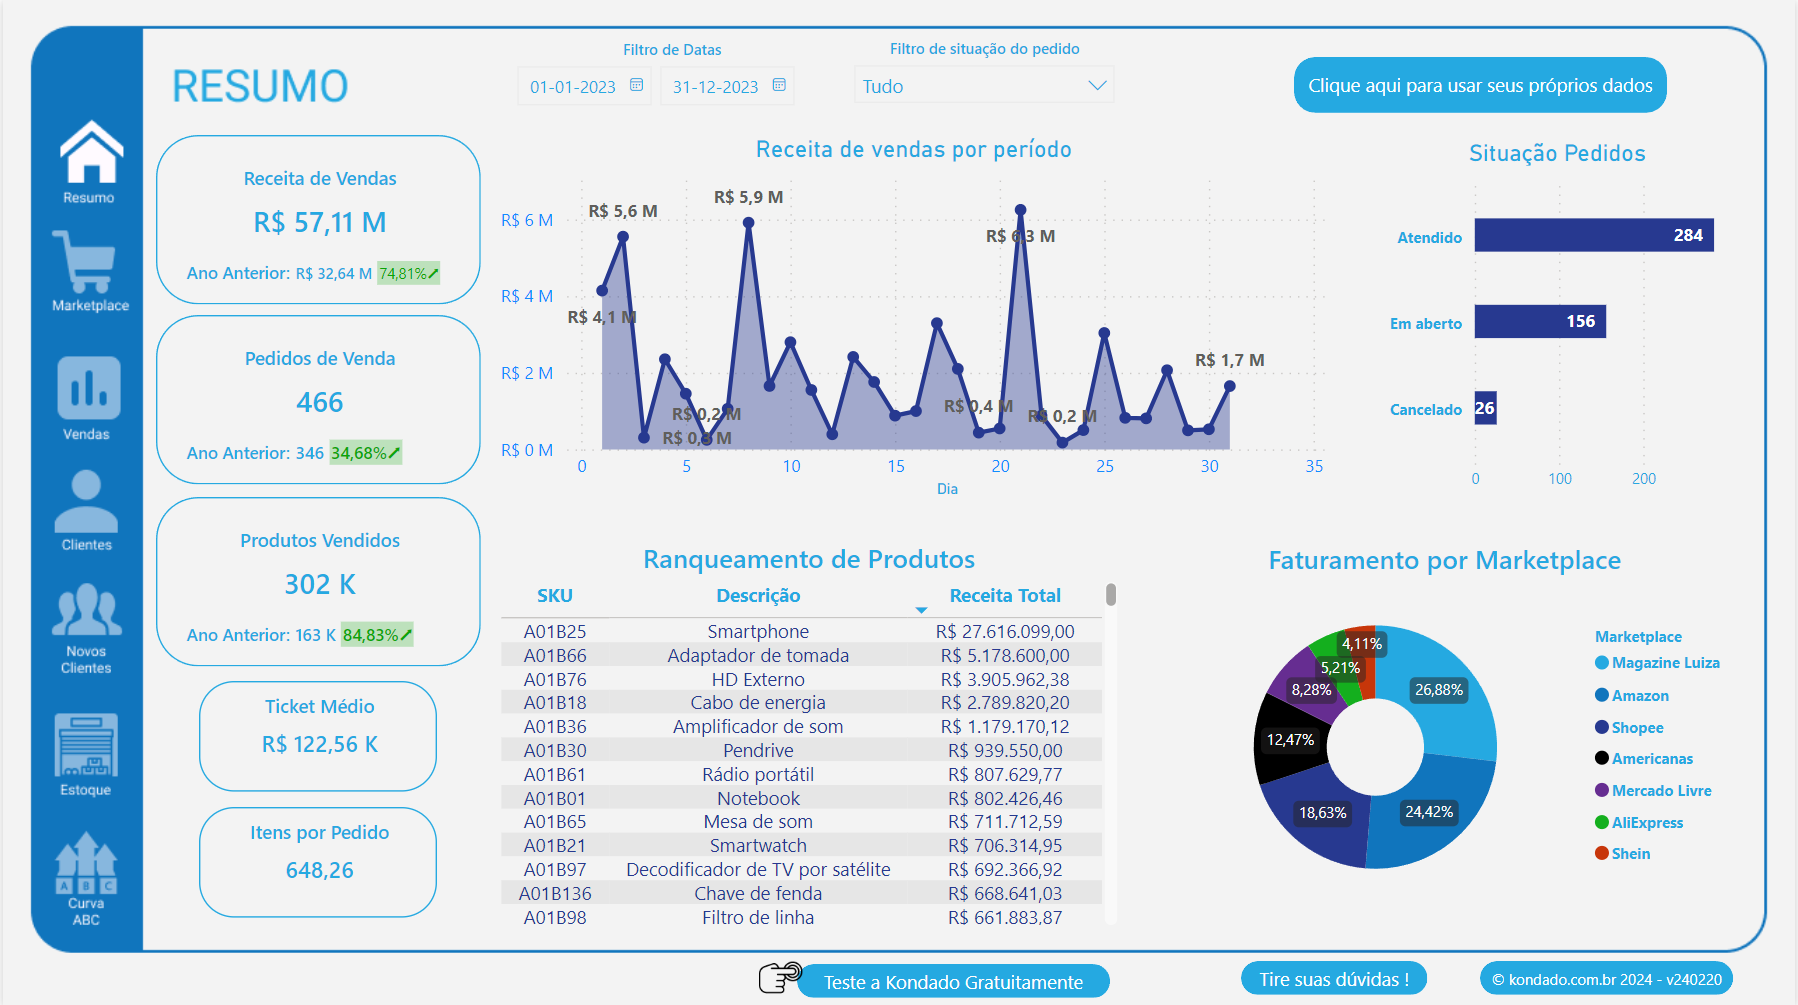
Each client uses a different ERP. Bling, Conta Azul, Omie, Tiny. Exporting spreadsheets from each, consolidating, and building reports takes hours. With Kondado, data arrives ready in the dashboard, updated automatically.
Problems every accounting firm knows:
Free dashboards for sales, inventory, and financials for the most popular ERPs
From ERP to report in minutes
Connect your clients ERPs and financial tools
Manage data from dozens of clients in the same Kondado account. Each integration is independent, with separate credentials and custom update frequencies. Ideal for BPOs that consolidate data from multiple companies into a single dashboard or spreadsheet.
Build your first client dashboard for free →Send ERP data to the tool your firm already uses
Conta Azul, Bling or Omie in Power BI with an always-current P&L
Build a P&L statement in Power BI or Looker Studio with data from Conta Azul, Bling, or Omie. Kondado replicates ERP transaction tables to your destination, preserving categories, accounts payable and receivable, sales, and financial movements (Omie: contas_a_pagar_lancamentos, contas_a_receber_lancamentos, categorias, movimentos_financeiros; Conta Azul: contas_a_pagar, contas_a_receber, vendas). You build a mapping table from ERP categories to P&L lines — Gross Revenue, Deductions, COGS, Gross Profit, Operating Expenses, Operating Profit (EBIT), Income Taxes, Net Income — and the report updates itself. Works for one client or for the entire firm portfolio.
Connect your client ERPs and visualize data automatically.
Choose the client ERP (Bling, Conta Azul, Omie, or Tiny) and authorize the connection in a few clicks.
Select Power BI, Looker Studio, Google Sheets, or Excel. Set the update frequency.
Data arrives automatically in the dashboard or spreadsheet. No manual export, no delays.
Answers for accountants and BPOs about data integration
contas_a_pagar_lancamentos, contas_a_receber_lancamentos, categorias, movimentos_financeiros; Conta Azul: contas_a_pagar, contas_a_receber, vendas with their category fields). In Power BI or Looker Studio you build a mapping table that translates each ERP category to a P&L line: Gross Revenue → Deductions → Net Revenue → COGS → Gross Profit → Operating Expenses → Operating Profit (EBIT) → Other Income/Expenses → Pre-Tax Income → Income Taxes (in Brazil: corporate income tax plus social contribution on net profit) → Net Income. From then on the report updates automatically as new entries arrive.
Tutorials on integrating ERPs into reports