Visualization tool
Visualize your data in Looker Studio with a few clicks
Get started for free
No credit card required | 14 days | 10 million records | 30 pipelines


or sign up with your email
By signing up, you agree to Kondado’s Terms of service and Privacy policy

Looker Studio
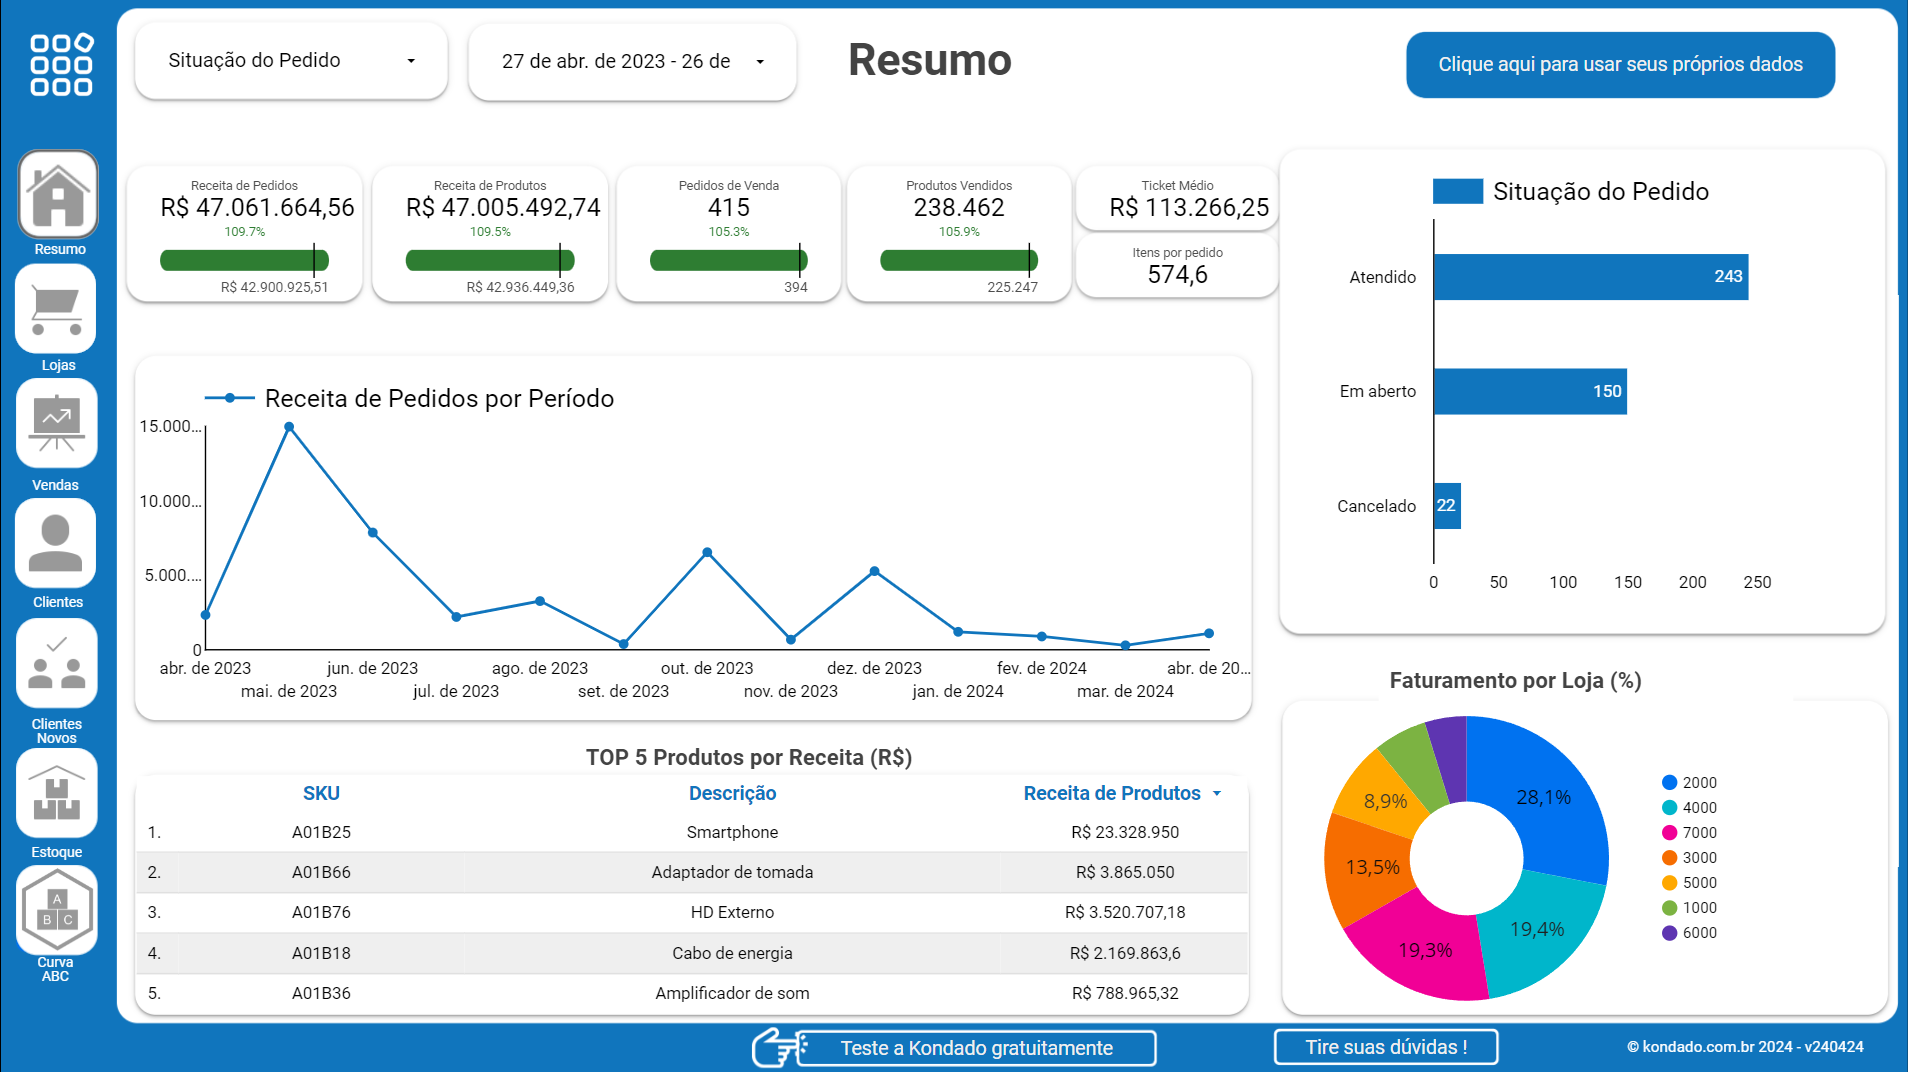
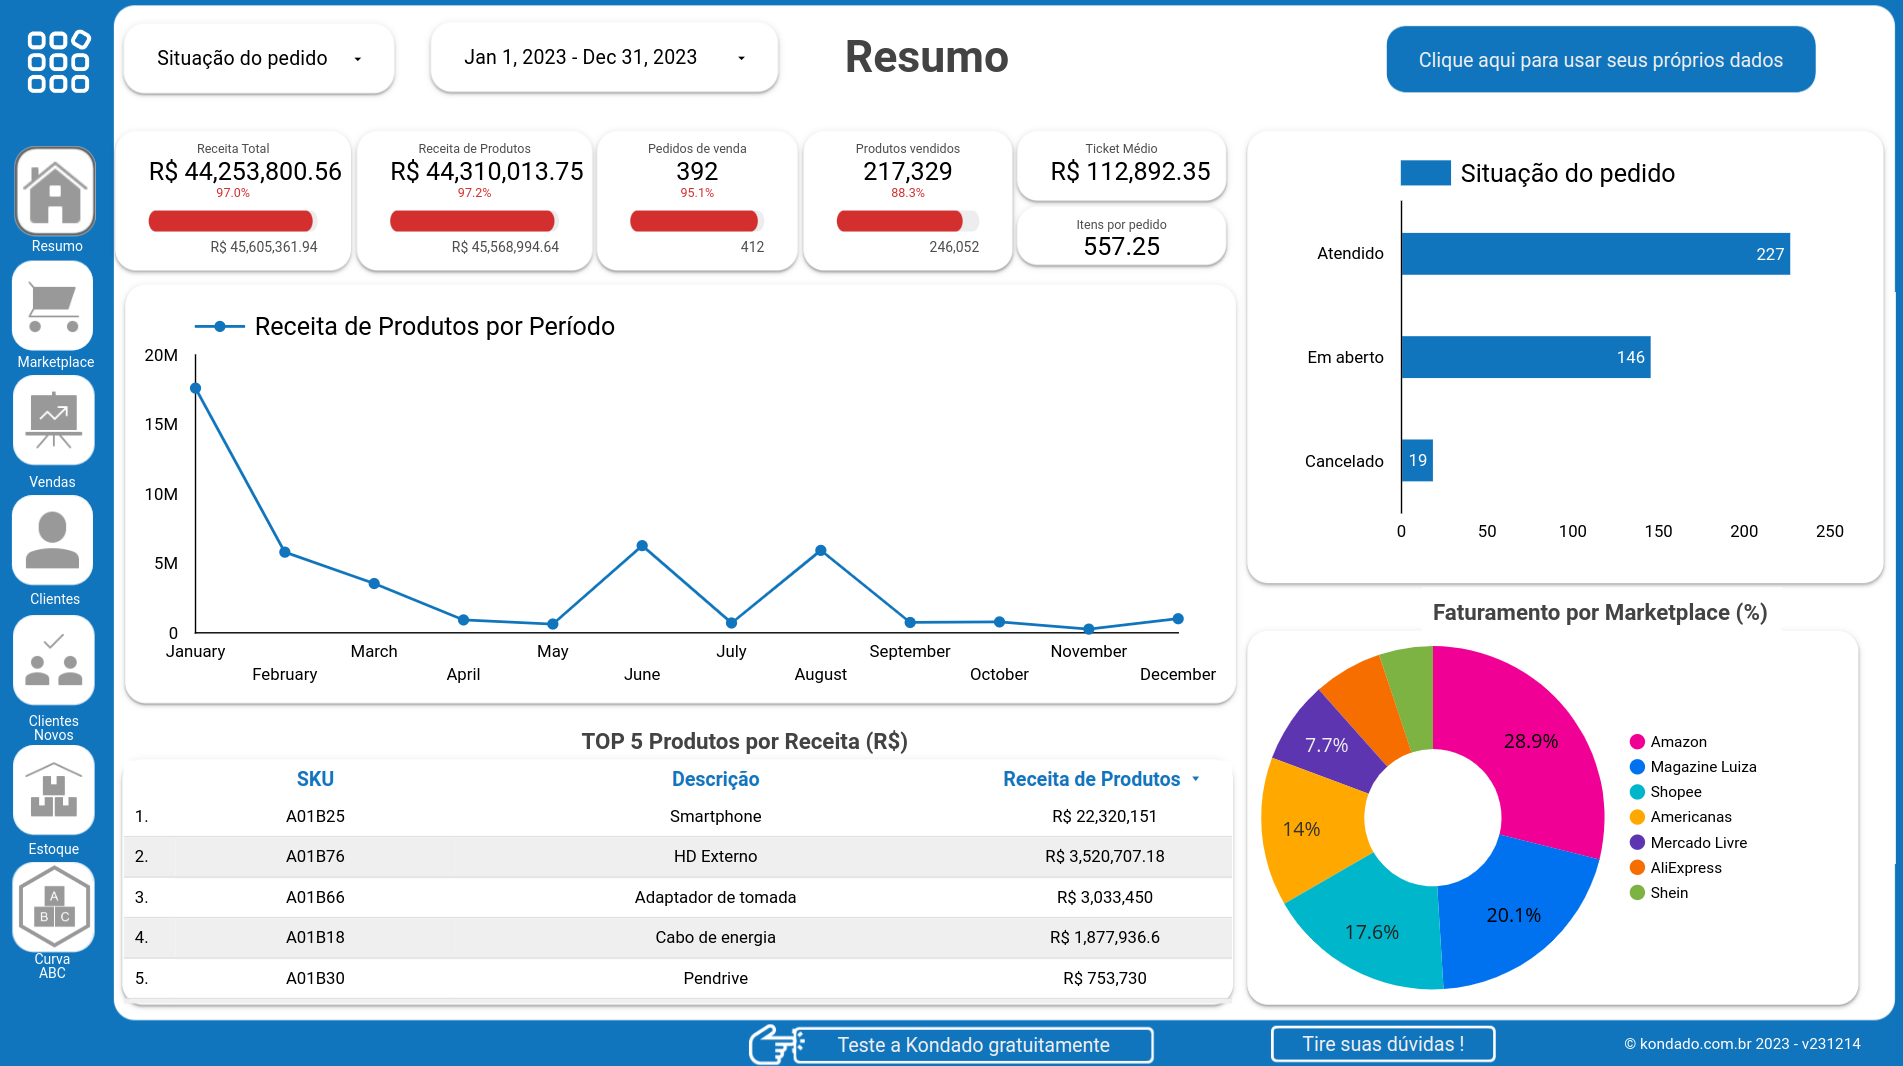
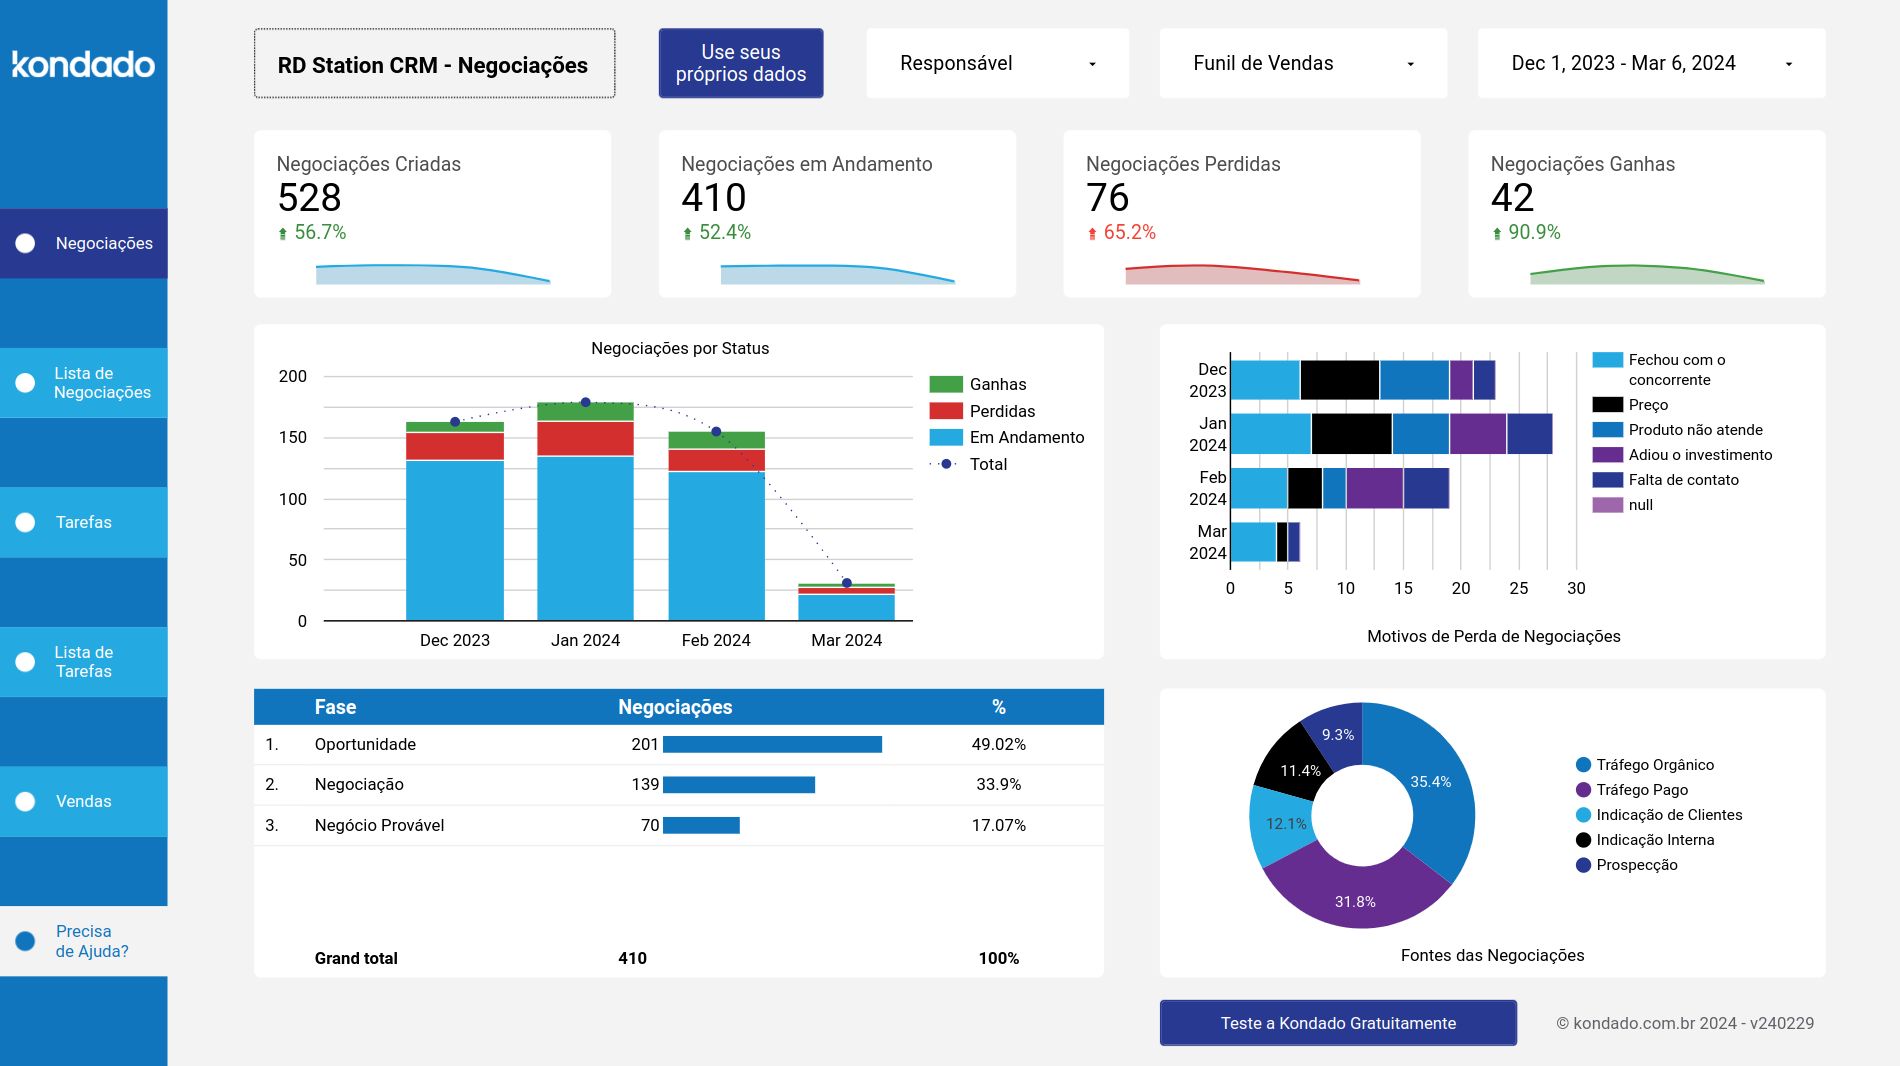
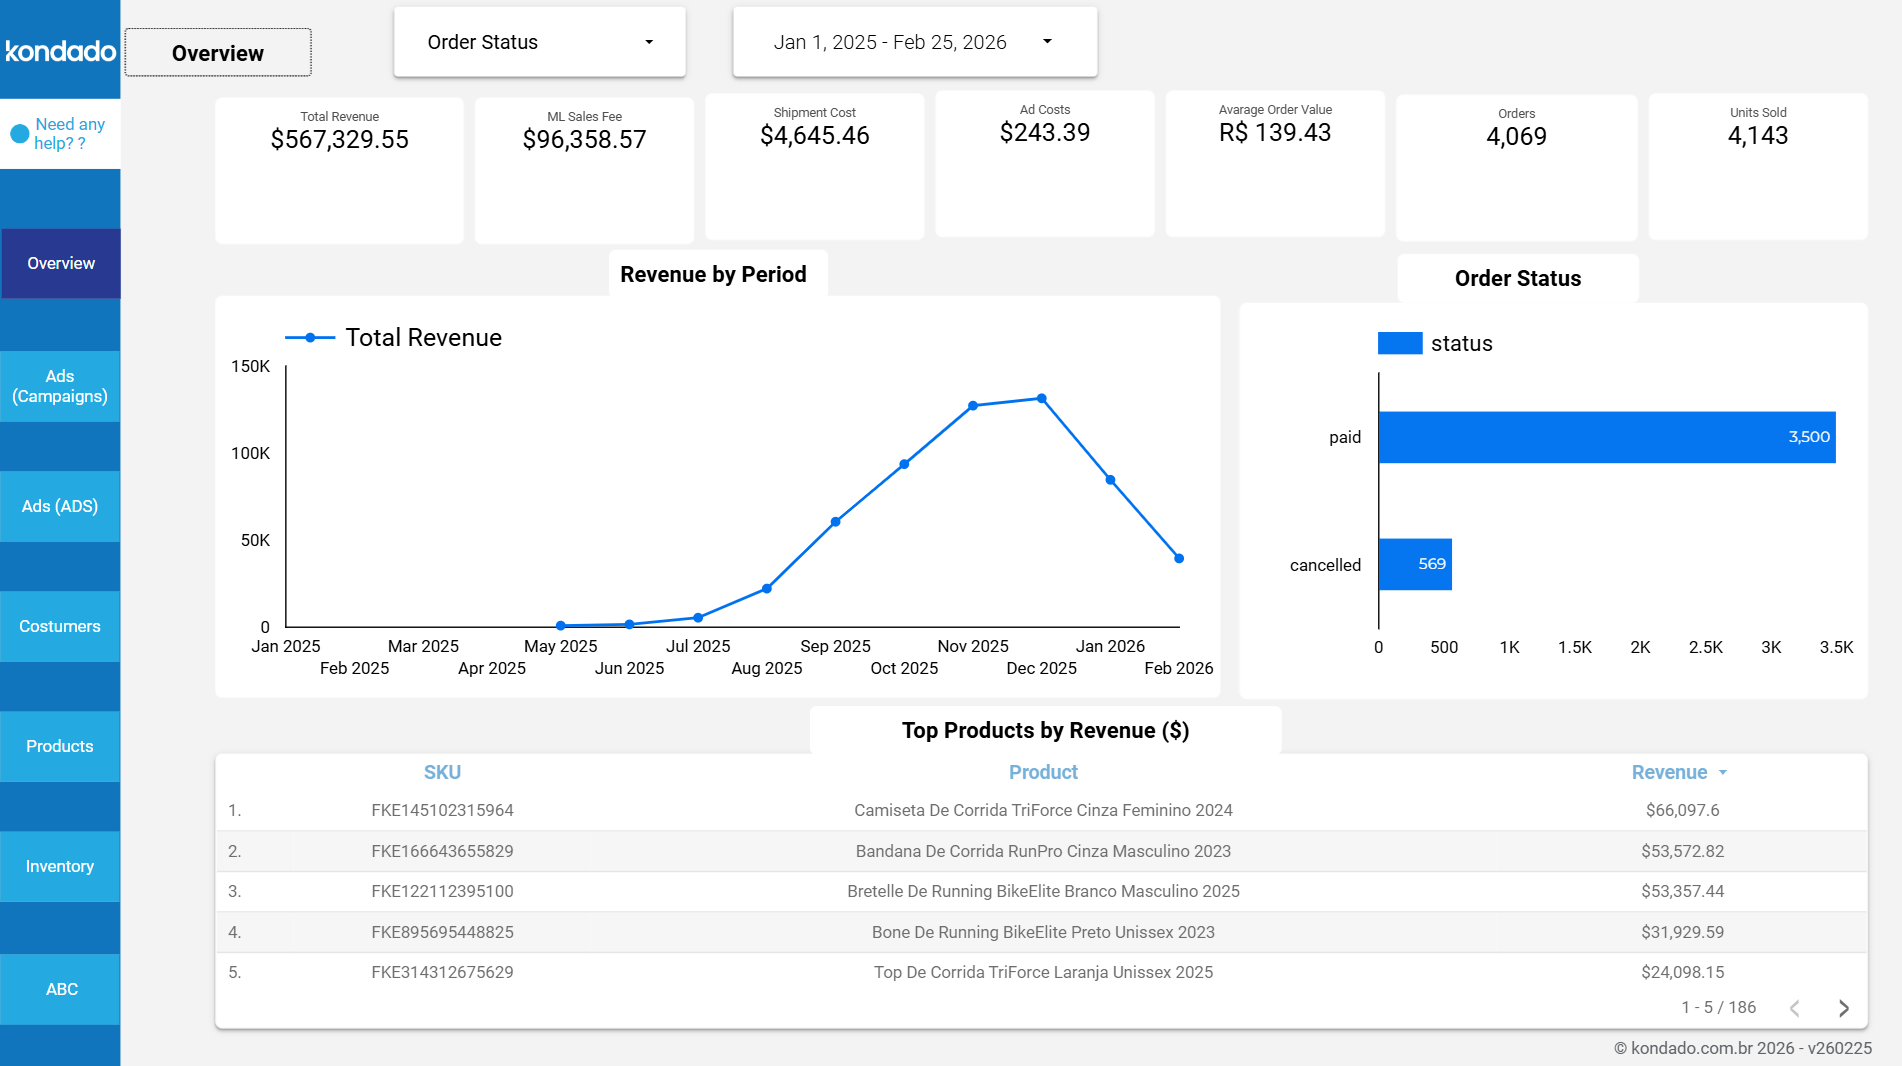
Looker Studio is an analytics tool developed by Google that allows even unexperienced users to create interactive charts and dashboards. Kondado sends your data to Looker Studio and, from there, you can create visualizations, charts, reports and KPIs


'%3E%3Cpath d='M51,41a9.978,9.978,0,0,0-7.857,3.835L22.648,34.588a9.69,9.69,0,0,0,0-5.176l20.5-10.247a10.1,10.1,0,1,0-1.791-3.577L20.857,25.835a10,10,0,1,0,0,12.33L41.352,48.412A9.994,9.994,0,1,0,51,41Z' fill='%23383e51'%3E%3C/path%3E%3C/g%3E%3C/svg%3E)
'%3E%3Cpath d='M33,47.645V60.71c.024-.014.05-.018.073-.033l11-7A2,2,0,0,0,45,51.992V40.012Z' fill='%23383e51'%3E%3C/path%3E%3Cpath d='M31,47.645,19,40.011V51.992a2,2,0,0,0,.927,1.688l11,7c.023.015.049.019.073.033Z' fill='%23383e51'%3E%3C/path%3E%3Cpath d='M32,21.693l12-7.634L33.076,7.086a2,2,0,0,0-2.152,0L20,14.059Z' fill='%23383e51'%3E%3C/path%3E%3Cpath d='M12,35.556,0,27.922V39.9A2,2,0,0,0,.927,41.59l11,7c.023.014.049.019.073.033Z' fill='%23383e51' data-color='color-2'%3E%3C/path%3E%3Cpath d='M52,35.556l12-7.634V39.9a2,2,0,0,1-.927,1.687l-11,7c-.023.014-.049.019-.073.033Z' fill='%23383e51' data-color='color-2'%3E%3C/path%3E%3Cpath d='M47,38.914a2,2,0,0,0-.924-1.686L38,32.074V27.922l12,7.634V48.621c-.024-.014-.05-.019-.073-.033L47,46.726Z' fill='%23383e51' data-color='color-2'%3E%3C/path%3E%3Cpath d='M13,33.821l12-7.634L14.076,19.214a2,2,0,0,0-2.152,0L1,26.187Z' fill='%23383e51' data-color='color-2'%3E%3C/path%3E%3Cpath d='M17,38.914a2,2,0,0,1,.924-1.686L26,32.074V27.922L14,35.556V48.621c.024-.014.05-.019.073-.033L17,46.726Z' fill='%23383e51' data-color='color-2'%3E%3C/path%3E%3Cpath d='M32,45.91l12-7.634L33.076,31.3a2,2,0,0,0-2.152,0L20,38.276Z' fill='%23383e51'%3E%3C/path%3E%3Cpath d='M14.076,19.214a2,2,0,0,0-2.152,0L1,26.187l12,7.634,12-7.634Z' fill='%23383e51' data-color='color-2'%3E%3C/path%3E%3Cpath d='M49.924,19.214a2,2,0,0,1,2.152,0L63,26.187,51,33.821,39,26.187Z' fill='%23383e51' data-color='color-2'%3E%3C/path%3E%3Cpath d='M26,27.922,14,35.556V48.621c.024-.014.05-.019.073-.033L17,46.726V38.914a2,2,0,0,1,.924-1.686L26,32.074Z' fill='%23383e51' data-color='color-2'%3E%3C/path%3E%3Cpath d='M27.076,25.138A2,2,0,0,1,28,26.824V30.8l1.848-1.179A4,4,0,0,1,31,29.123V23.428L19,15.794v4.19Z' fill='%23383e51'%3E%3C/path%3E%3Cpath d='M36.924,25.138A2,2,0,0,0,36,26.824V30.8l-1.848-1.179A4,4,0,0,0,33,29.123V23.428l12-7.634v4.19Z' fill='%23383e51'%3E%3C/path%3E%3Cpath d='M33.076,31.3a2,2,0,0,0-2.152,0L20,38.276,32,45.91l12-7.634Z' fill='%23383e51'%3E%3C/path%3E%3C/g%3E%3C/svg%3E)
'%3E%3Cpath d='M50.348,42.573c0-9.411-8.691-12.336-16.348-14.416v-16.1a32.837,32.837,0,0,1,9.363,1.656l2.778,1.11,2.228-5.57L45.584,8.134A38.043,38.043,0,0,0,34,6.046V1H30V6.081c-8.213.594-16.348,4.86-16.348,13.471,0,9.036,8.841,11.732,16.348,13.744V50.074a33.591,33.591,0,0,1-12.006-2.511l-2.683-1.341-2.684,5.367,2.684,1.342c.243.121,5.7,2.792,14.689,3.152V63h4V56.065C44,55.462,50.348,50.3,50.348,42.573Zm-30.7-23.021c0-5.133,5.96-7.016,10.348-7.446V27.071C23.512,25.243,19.652,23.535,19.652,19.552ZM34,50.043V34.393c6.5,1.882,10.348,3.761,10.348,8.18C44.348,48.377,37.873,49.744,34,50.043Z' fill='%23383e51'%3E%3C/path%3E%3C/g%3E%3C/svg%3E)