Connect your Bling! ERP to Looker Studio without complex technical setup or database configuration. Kondado offers a direct connection that lets you replicate your sales, inventory, and financial data from Bling! into beautiful, interactive dashboards. Choose from 30 available pipelines covering everything from sales orders to cash transactions, then visualize your business metrics in minutes rather than hours. Configure automated updates on your preferred schedule, whether every 15 minutes or daily, ensuring your reports always reflect current operations and eliminating manual spreadsheet work.
Kondado connects Bling! to Looker Studio through a “Via Kondado” data source, requiring no intermediate databases or coding knowledge, allowing business teams to build automated dashboards with data refreshed on a configurable schedule.
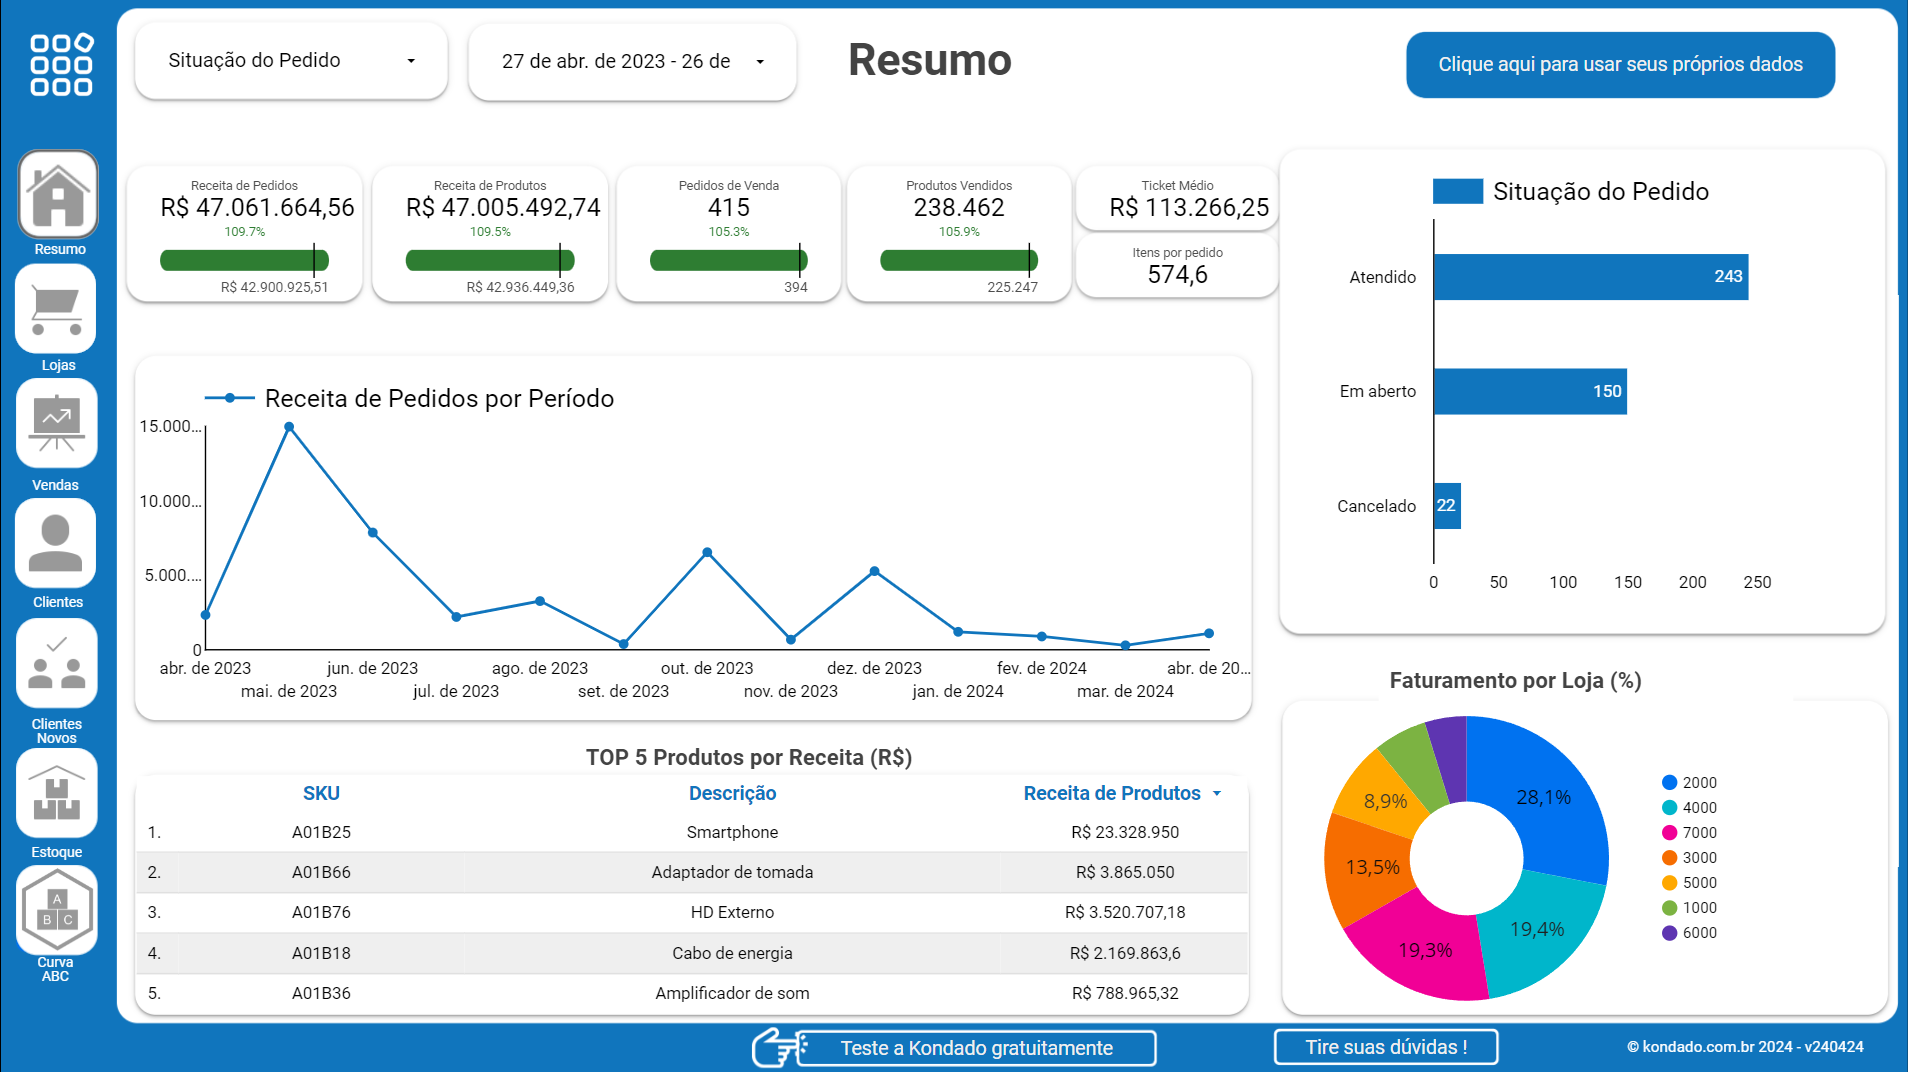
Transform raw ERP information into actionable insights that drive smarter decisions across sales, finance, and operations teams. Track current inventory levels, monitor accounts payable and receivable aging, and analyze sales performance by category without manual exports. With automated updates handling your data preparation, your team spends less time gathering information and more time acting on insights that grow your business.
Combine your Bling! ERP data with Looker Studio’s visualization power to unlock complete visibility into your business performance. By replicating Sales Orders and Products: Stock pipelines alongside Cash and Banks: Transactions, you can create unified dashboards that connect inventory movement with financial impact. Monitor which product categories drive the most revenue while tracking pending accounts receivable to optimize cash flow management. These combined insights help SMBs identify profitable trends, prevent stockouts before they happen, and make confident decisions about purchasing and sales strategies without any technical complexity or manual data preparation.
Visualize your data automatically — no spreadsheet exports or custom scripts.
1
Connect Bling! as data source
Log into Kondado and select Bling! from our catalog of 80+ sources, then enter your Bling! API credentials to establish the connection. Choose from 30 available pipelines including Sales Orders, Products, and financial data to determine which business information to replicate.
2
Select Looker Studio destination
Choose Looker Studio as your visualization destination and configure the "Via Kondado" connection method for direct data access. This creates a seamless link between your Bling! ERP and reporting environment without requiring intermediate databases or complex technical configuration.
3
Build dashboards and configure refresh
Access your replicated Bling! data in Looker Studio to create charts, scorecards, and KPIs that visualize sales trends, inventory levels, and financial metrics. Set your preferred update frequency, from every 5 minutes to daily, to keep reports current automatically without manual intervention.
Try out all the features for free for 14 days
Access Bling! data in Looker Studio and combine it with dozens of other data sources
If the source you want is not listed, drop us a chat message. We love to add new sources!
Answers about visualizing Bling! data in Looker Studio automatically
How do I connect Bling! to Looker Studio using Kondado?▼
Start by selecting Bling! as your data source in Kondado, then authenticate with your Bling! credentials. Choose Looker Studio as your destination and select which pipelines you want to replicate, such as Sales Orders or Accounts Receivable. The connection uses a "Via Kondado" data source that requires no database configuration or technical setup.
What dashboards can I build with Bling! data in Looker Studio?▼
You can build comprehensive financial dashboards tracking cash flow and accounts payable, operational reports monitoring inventory levels across Products: Stock, and sales performance views analyzing Sales Orders by category. Combine data from multiple pipelines to create executive summaries that show the relationship between sales velocity, inventory turnover, and financial health in a single view.
How often does Bling! data update in Looker Studio?▼
Kondado lets you configure automated updates on a schedule that fits your business needs, ranging from every 5 minutes to daily intervals. Once configured, your Looker Studio dashboards refresh automatically, ensuring your team always works with current information without manual exports or updates.
What specific KPIs should I track from Bling! in Looker Studio?▼
Focus on metrics like inventory turnover from Products: Stock, days sales outstanding from Accounts Receivable, and cash conversion cycles using Cash and Banks: Transactions. Track sales order fulfillment rates and category performance to identify your most profitable product lines and optimize purchasing decisions based on actual demand patterns.
Are there pre-built dashboard templates for Bling! and Looker Studio?▼
Yes, Kondado offers ready-made report templates including the Bling! Looker Studio Report, which provides immediate visualizations for common ERP metrics. You can also explore the Bling! Power BI Report if you prefer Power BI as an alternative destination, both designed to deliver instant insights without building dashboards from scratch.
Can I share Bling! dashboards with my team in Looker Studio?▼
Absolutely, once your data flows into Looker Studio, you can share dashboards with unlimited viewers across your organization. Set up automated email delivery of reports to stakeholders, ensuring everyone from sales managers to financial controllers accesses the same current Bling! data without needing direct ERP access.
Do I need technical skills to set up the Bling! connection?▼
No coding or database knowledge is required to connect Bling! to Looker Studio. The setup process involves simple point-and-click selection of your desired pipelines and configuration of update schedules. Business users, marketing teams, and operations managers can independently manage their data replication without IT assistance.


'%3E%3Cpath d='M51,41a9.978,9.978,0,0,0-7.857,3.835L22.648,34.588a9.69,9.69,0,0,0,0-5.176l20.5-10.247a10.1,10.1,0,1,0-1.791-3.577L20.857,25.835a10,10,0,1,0,0,12.33L41.352,48.412A9.994,9.994,0,1,0,51,41Z' fill='%23383e51'%3E%3C/path%3E%3C/g%3E%3C/svg%3E)
'%3E%3Cpath d='M33,47.645V60.71c.024-.014.05-.018.073-.033l11-7A2,2,0,0,0,45,51.992V40.012Z' fill='%23383e51'%3E%3C/path%3E%3Cpath d='M31,47.645,19,40.011V51.992a2,2,0,0,0,.927,1.688l11,7c.023.015.049.019.073.033Z' fill='%23383e51'%3E%3C/path%3E%3Cpath d='M32,21.693l12-7.634L33.076,7.086a2,2,0,0,0-2.152,0L20,14.059Z' fill='%23383e51'%3E%3C/path%3E%3Cpath d='M12,35.556,0,27.922V39.9A2,2,0,0,0,.927,41.59l11,7c.023.014.049.019.073.033Z' fill='%23383e51' data-color='color-2'%3E%3C/path%3E%3Cpath d='M52,35.556l12-7.634V39.9a2,2,0,0,1-.927,1.687l-11,7c-.023.014-.049.019-.073.033Z' fill='%23383e51' data-color='color-2'%3E%3C/path%3E%3Cpath d='M47,38.914a2,2,0,0,0-.924-1.686L38,32.074V27.922l12,7.634V48.621c-.024-.014-.05-.019-.073-.033L47,46.726Z' fill='%23383e51' data-color='color-2'%3E%3C/path%3E%3Cpath d='M13,33.821l12-7.634L14.076,19.214a2,2,0,0,0-2.152,0L1,26.187Z' fill='%23383e51' data-color='color-2'%3E%3C/path%3E%3Cpath d='M17,38.914a2,2,0,0,1,.924-1.686L26,32.074V27.922L14,35.556V48.621c.024-.014.05-.019.073-.033L17,46.726Z' fill='%23383e51' data-color='color-2'%3E%3C/path%3E%3Cpath d='M32,45.91l12-7.634L33.076,31.3a2,2,0,0,0-2.152,0L20,38.276Z' fill='%23383e51'%3E%3C/path%3E%3Cpath d='M14.076,19.214a2,2,0,0,0-2.152,0L1,26.187l12,7.634,12-7.634Z' fill='%23383e51' data-color='color-2'%3E%3C/path%3E%3Cpath d='M49.924,19.214a2,2,0,0,1,2.152,0L63,26.187,51,33.821,39,26.187Z' fill='%23383e51' data-color='color-2'%3E%3C/path%3E%3Cpath d='M26,27.922,14,35.556V48.621c.024-.014.05-.019.073-.033L17,46.726V38.914a2,2,0,0,1,.924-1.686L26,32.074Z' fill='%23383e51' data-color='color-2'%3E%3C/path%3E%3Cpath d='M27.076,25.138A2,2,0,0,1,28,26.824V30.8l1.848-1.179A4,4,0,0,1,31,29.123V23.428L19,15.794v4.19Z' fill='%23383e51'%3E%3C/path%3E%3Cpath d='M36.924,25.138A2,2,0,0,0,36,26.824V30.8l-1.848-1.179A4,4,0,0,0,33,29.123V23.428l12-7.634v4.19Z' fill='%23383e51'%3E%3C/path%3E%3Cpath d='M33.076,31.3a2,2,0,0,0-2.152,0L20,38.276,32,45.91l12-7.634Z' fill='%23383e51'%3E%3C/path%3E%3C/g%3E%3C/svg%3E)
'%3E%3Cpath d='M50.348,42.573c0-9.411-8.691-12.336-16.348-14.416v-16.1a32.837,32.837,0,0,1,9.363,1.656l2.778,1.11,2.228-5.57L45.584,8.134A38.043,38.043,0,0,0,34,6.046V1H30V6.081c-8.213.594-16.348,4.86-16.348,13.471,0,9.036,8.841,11.732,16.348,13.744V50.074a33.591,33.591,0,0,1-12.006-2.511l-2.683-1.341-2.684,5.367,2.684,1.342c.243.121,5.7,2.792,14.689,3.152V63h4V56.065C44,55.462,50.348,50.3,50.348,42.573Zm-30.7-23.021c0-5.133,5.96-7.016,10.348-7.446V27.071C23.512,25.243,19.652,23.535,19.652,19.552ZM34,50.043V34.393c6.5,1.882,10.348,3.761,10.348,8.18C44.348,48.377,37.873,49.744,34,50.043Z' fill='%23383e51'%3E%3C/path%3E%3C/g%3E%3C/svg%3E)