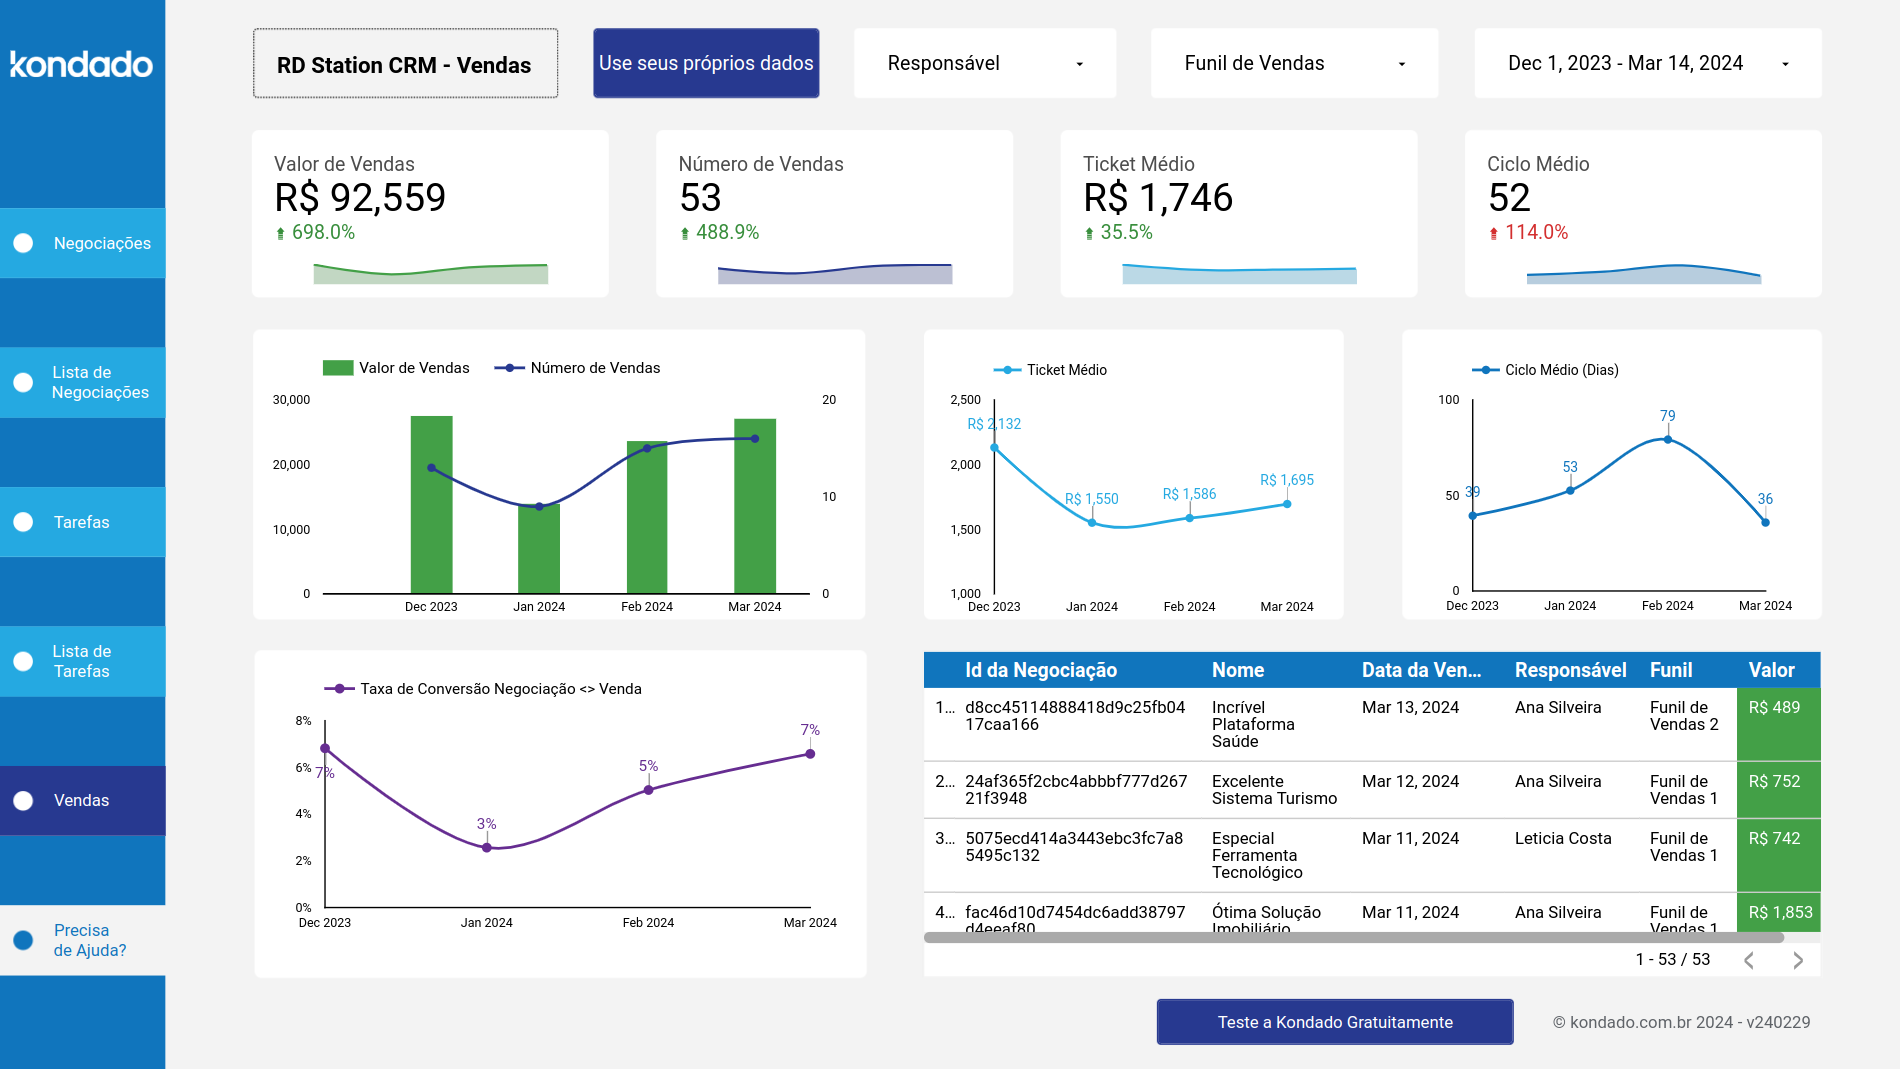
Average Cycle Chart in the RD Station CRM Looker Studio (now Data Studio) Report on Looker Studio
Get started for free
No credit card required | 14 days | 10 million records | 30 pipelines


or sign up with your email
By signing up, you agree to Kondado’s Terms of service and Privacy policy
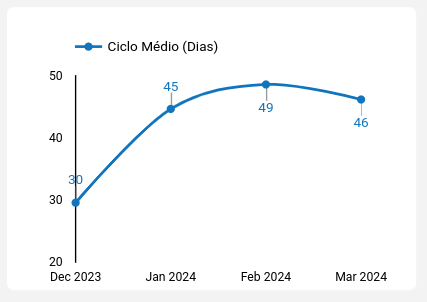
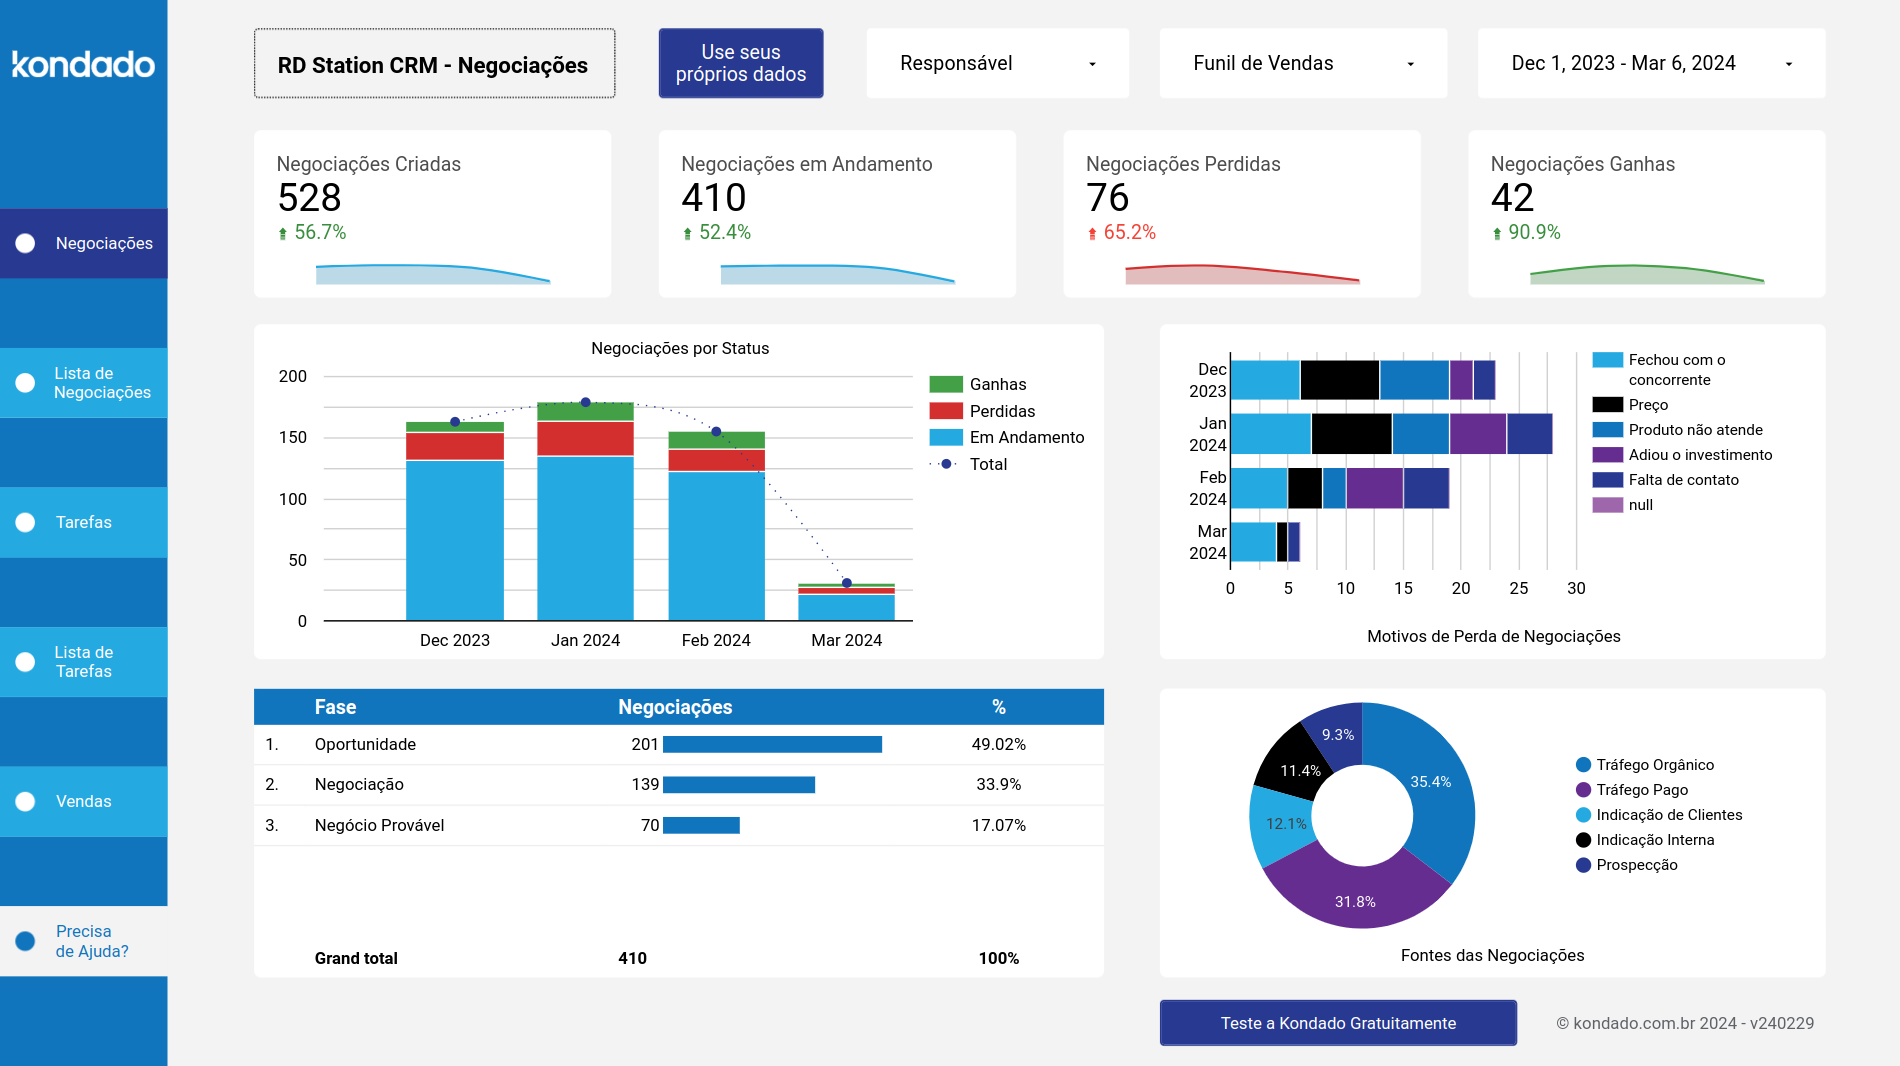
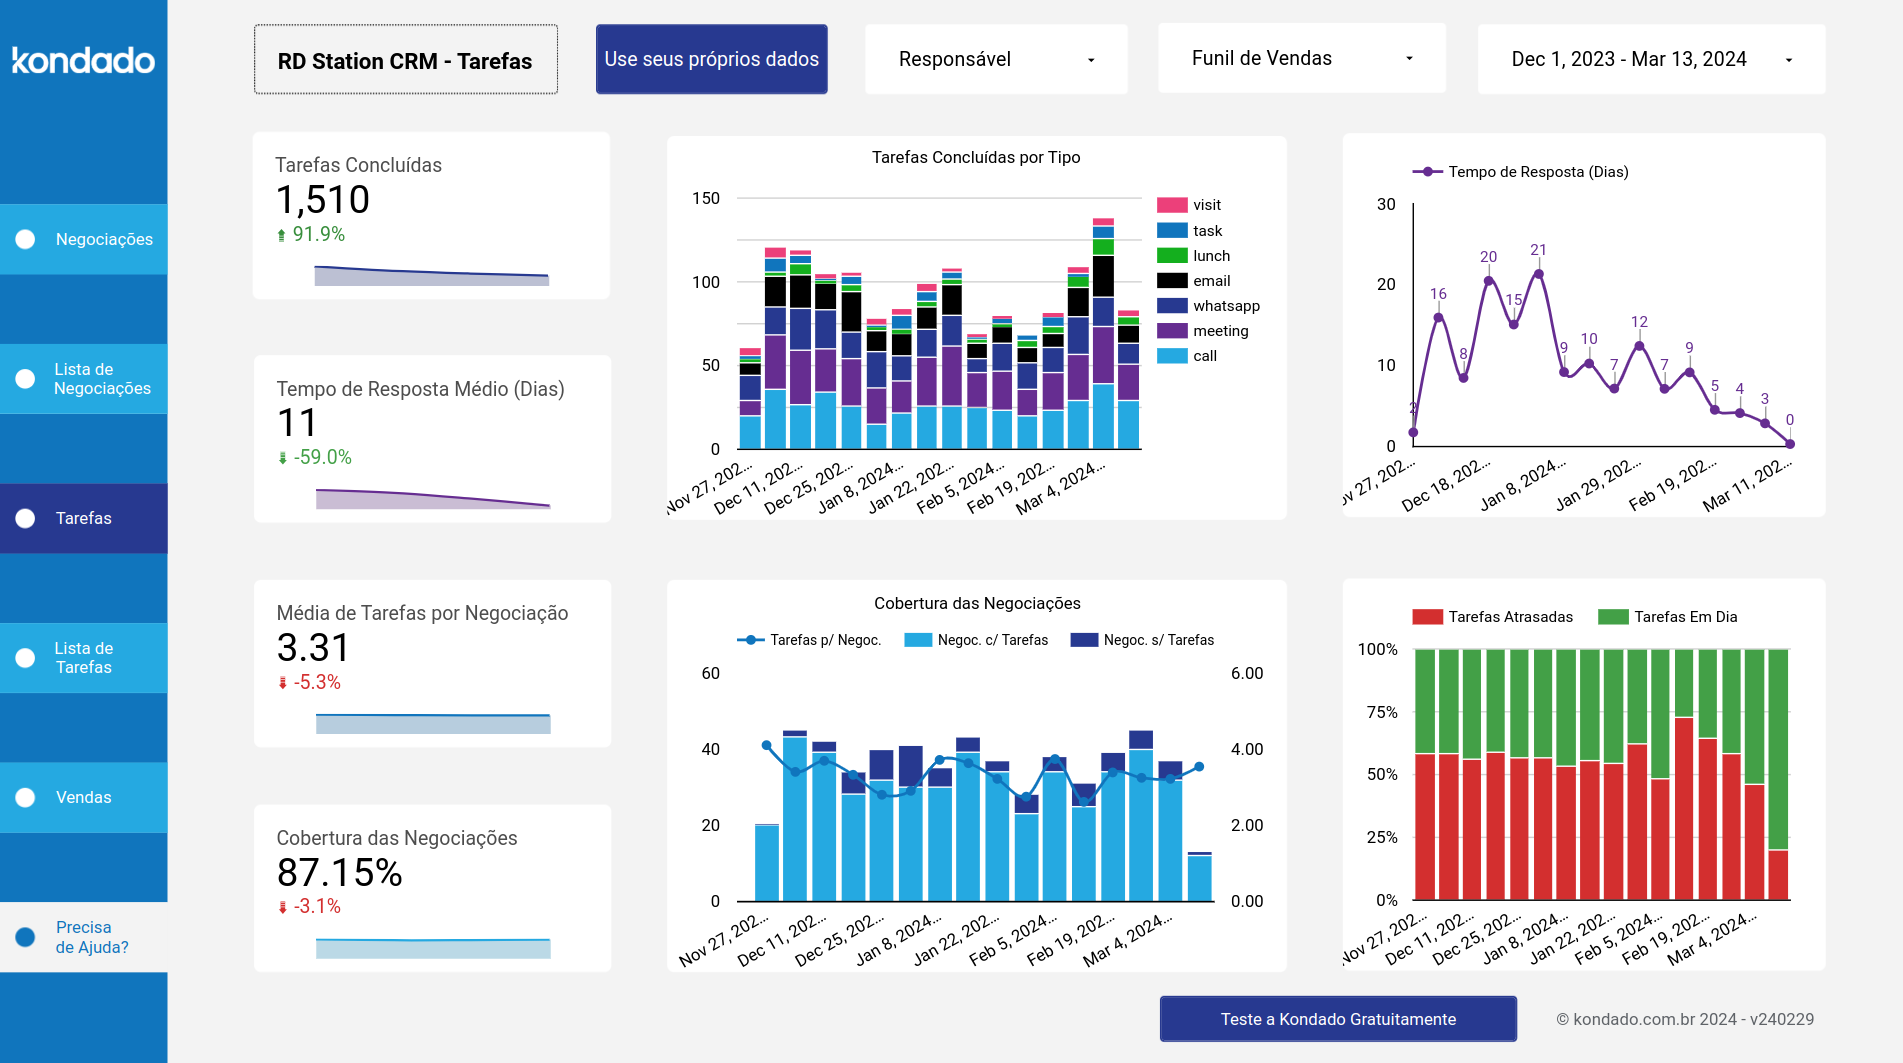
Understand the efficiency of your sales process with the 'Average Cycle' chart from the RD Station CRM Looker Studio (now Data Studio) Report on Looker Studio, presented by Kondado. This crucial chart highlights the average duration from the start to the closing of sales, adaptable for different periods through filters. By integrating your RD Station CRM data with Kondado, you gain valuable insights into the time it takes to convert opportunities into actual sales. This analysis helps identify bottlenecks and opportunities for optimization in your sales process, allowing the implementation of improvements that accelerate the sales cycle, increase efficiency, and boost the overall business results
Try out all the features for free for 14 days