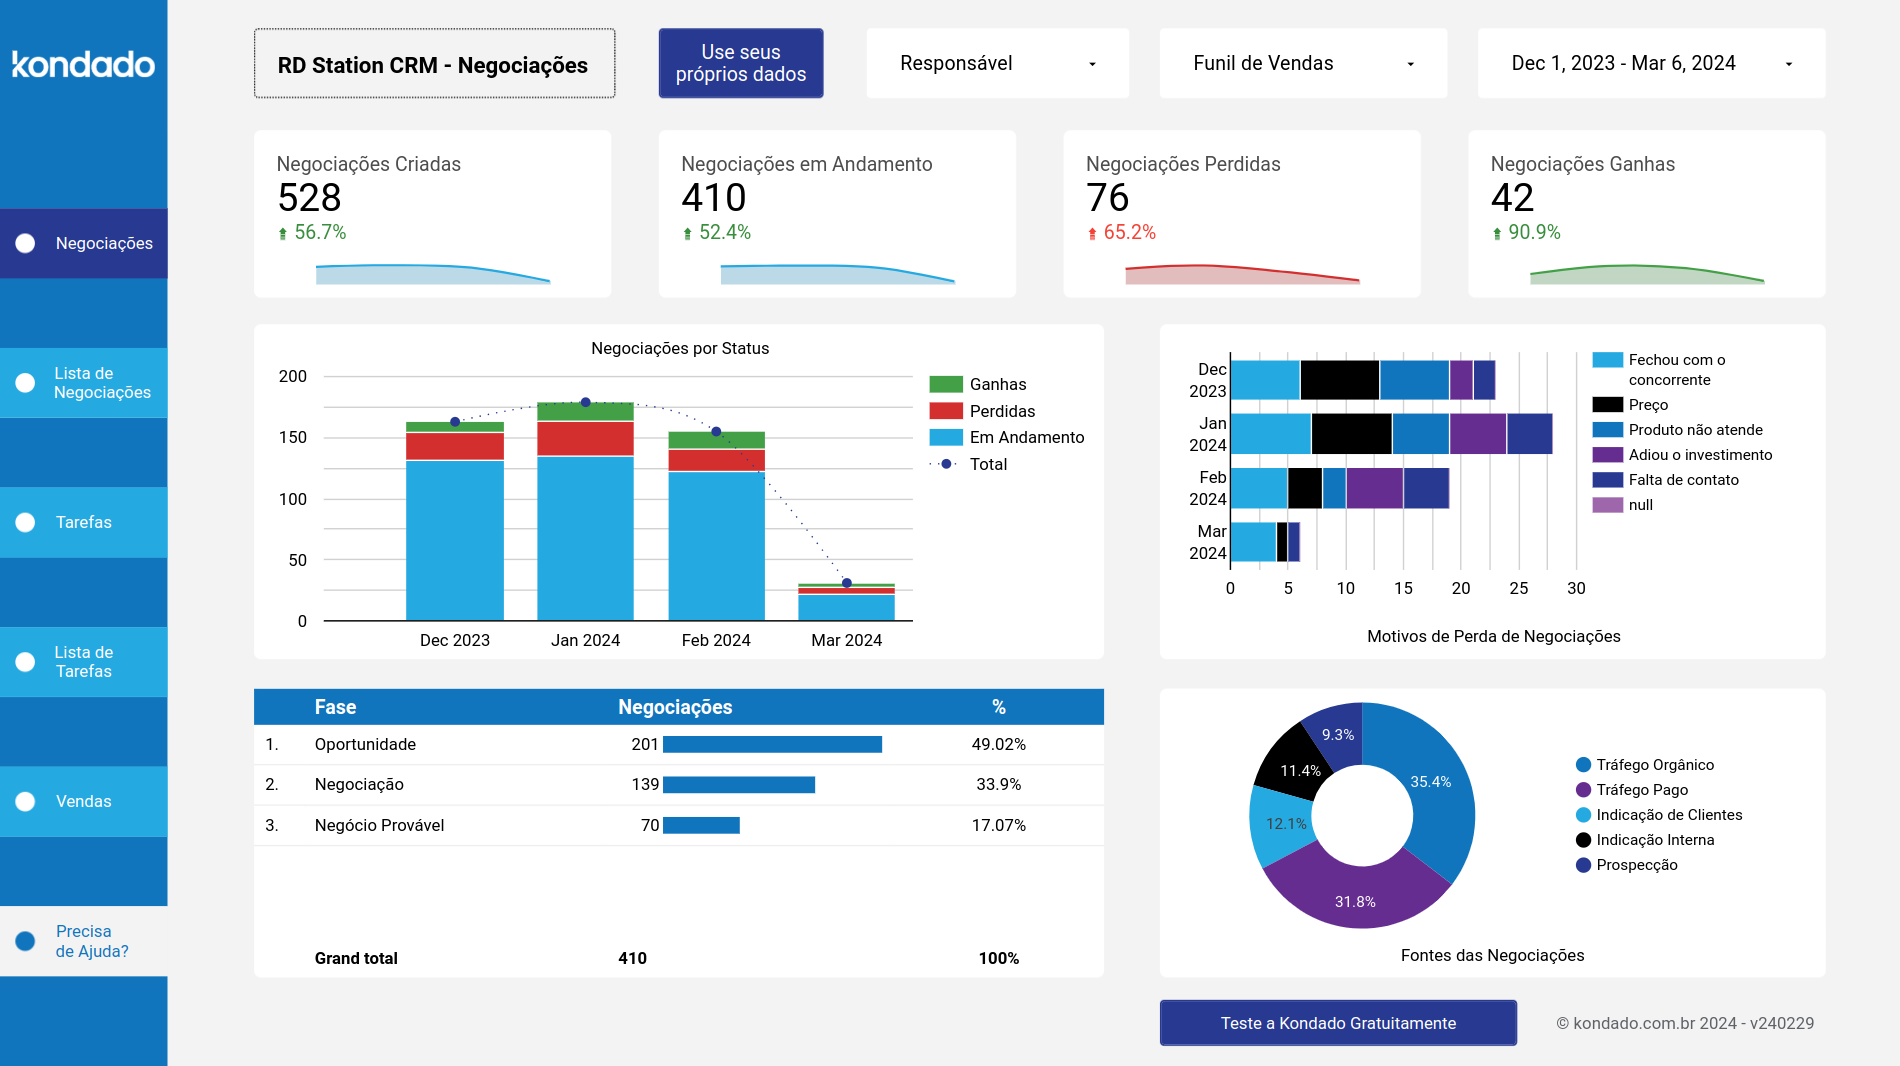
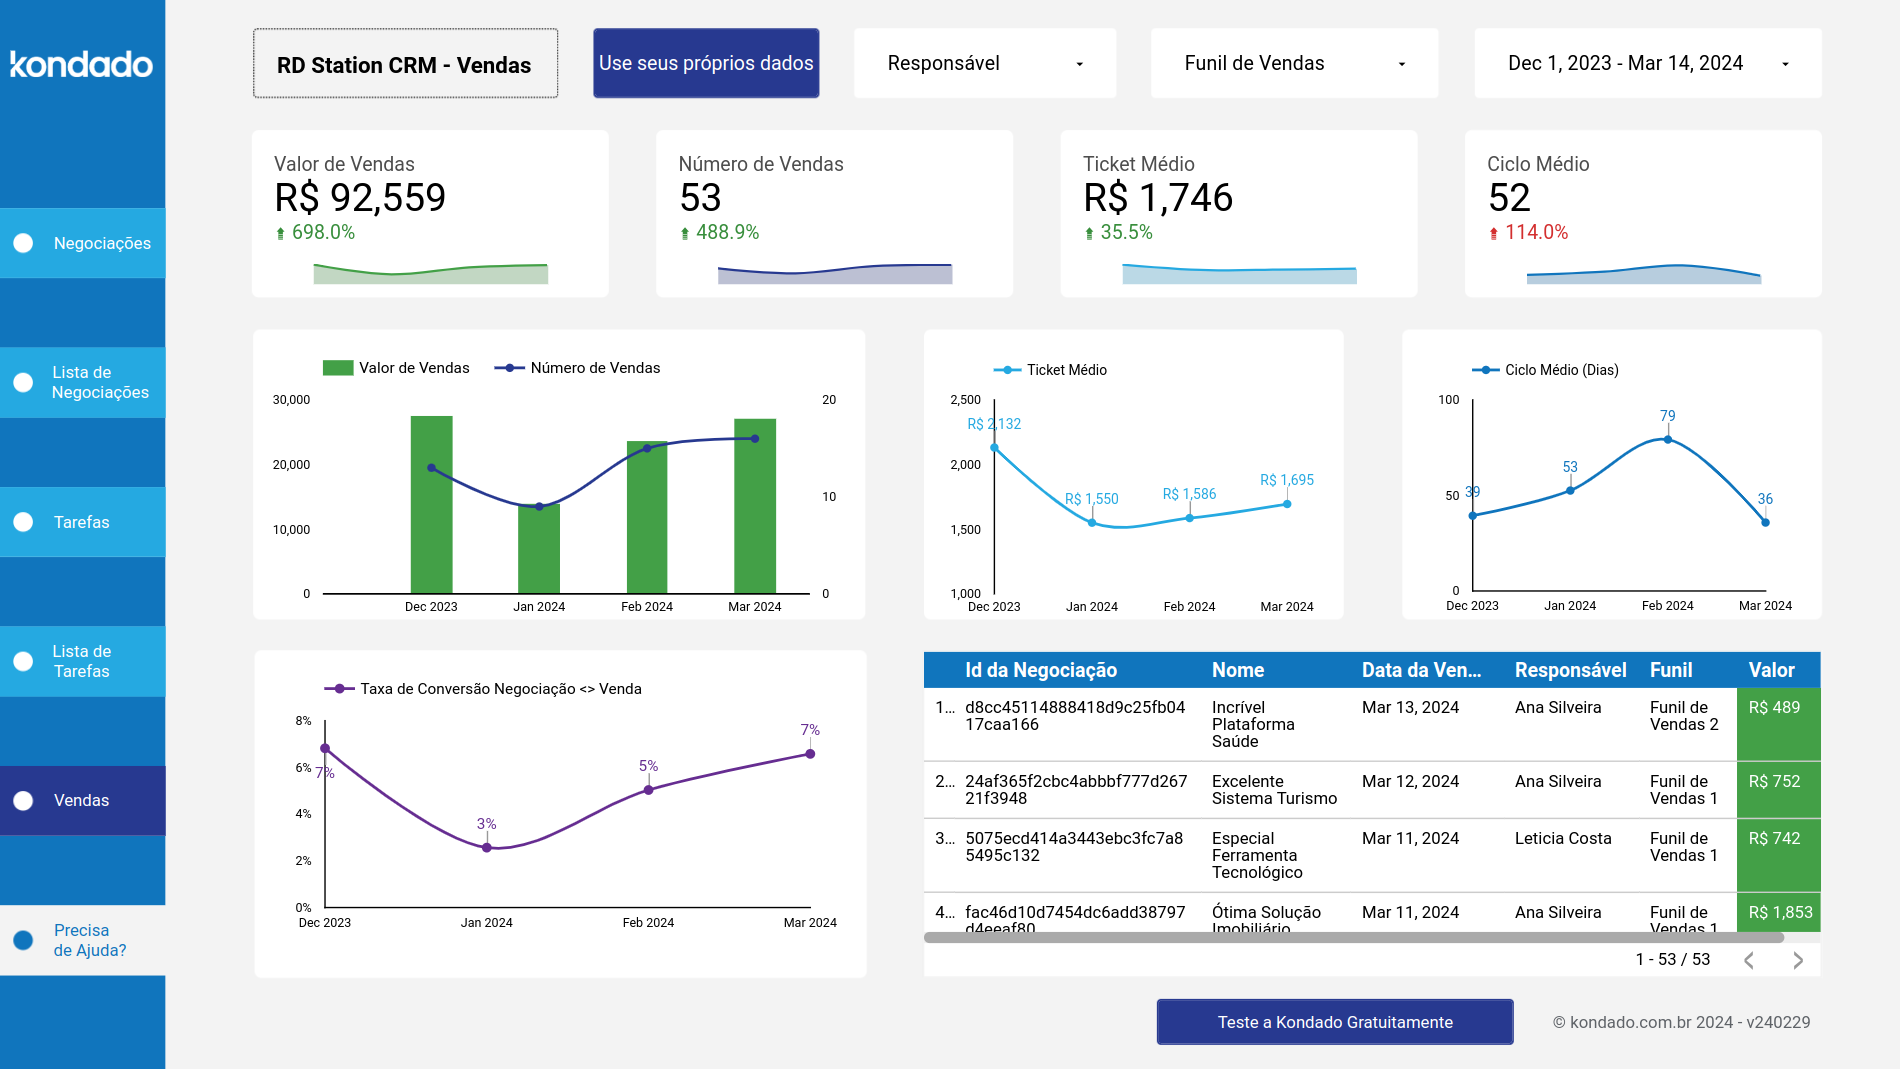
Sales Number Chart on RD Station CRM Looker Studio (now Data Studio) Report
Get started for free
No credit card required | 14 days | 10 million records | 30 pipelines


or sign up with your email
By signing up, you agree to Kondado’s Terms of service and Privacy policy
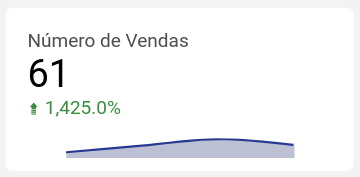
Discover sales dynamics with the 'Number of Sales' graph from the RD Station CRM Looker Studio (now Data Studio) Report, created by Kondado. This graph allows you to clearly see the quantity of sales made over different periods, applying filters as needed. By integrating your RD Station CRM data with Kondado, you gain a deep understanding of sales volume, helping identify trends and patterns in customer buying behavior. This insight is crucial for adjusting your sales and marketing strategies to optimize overall performance and drive company growth
Try out all the features for free for 14 days