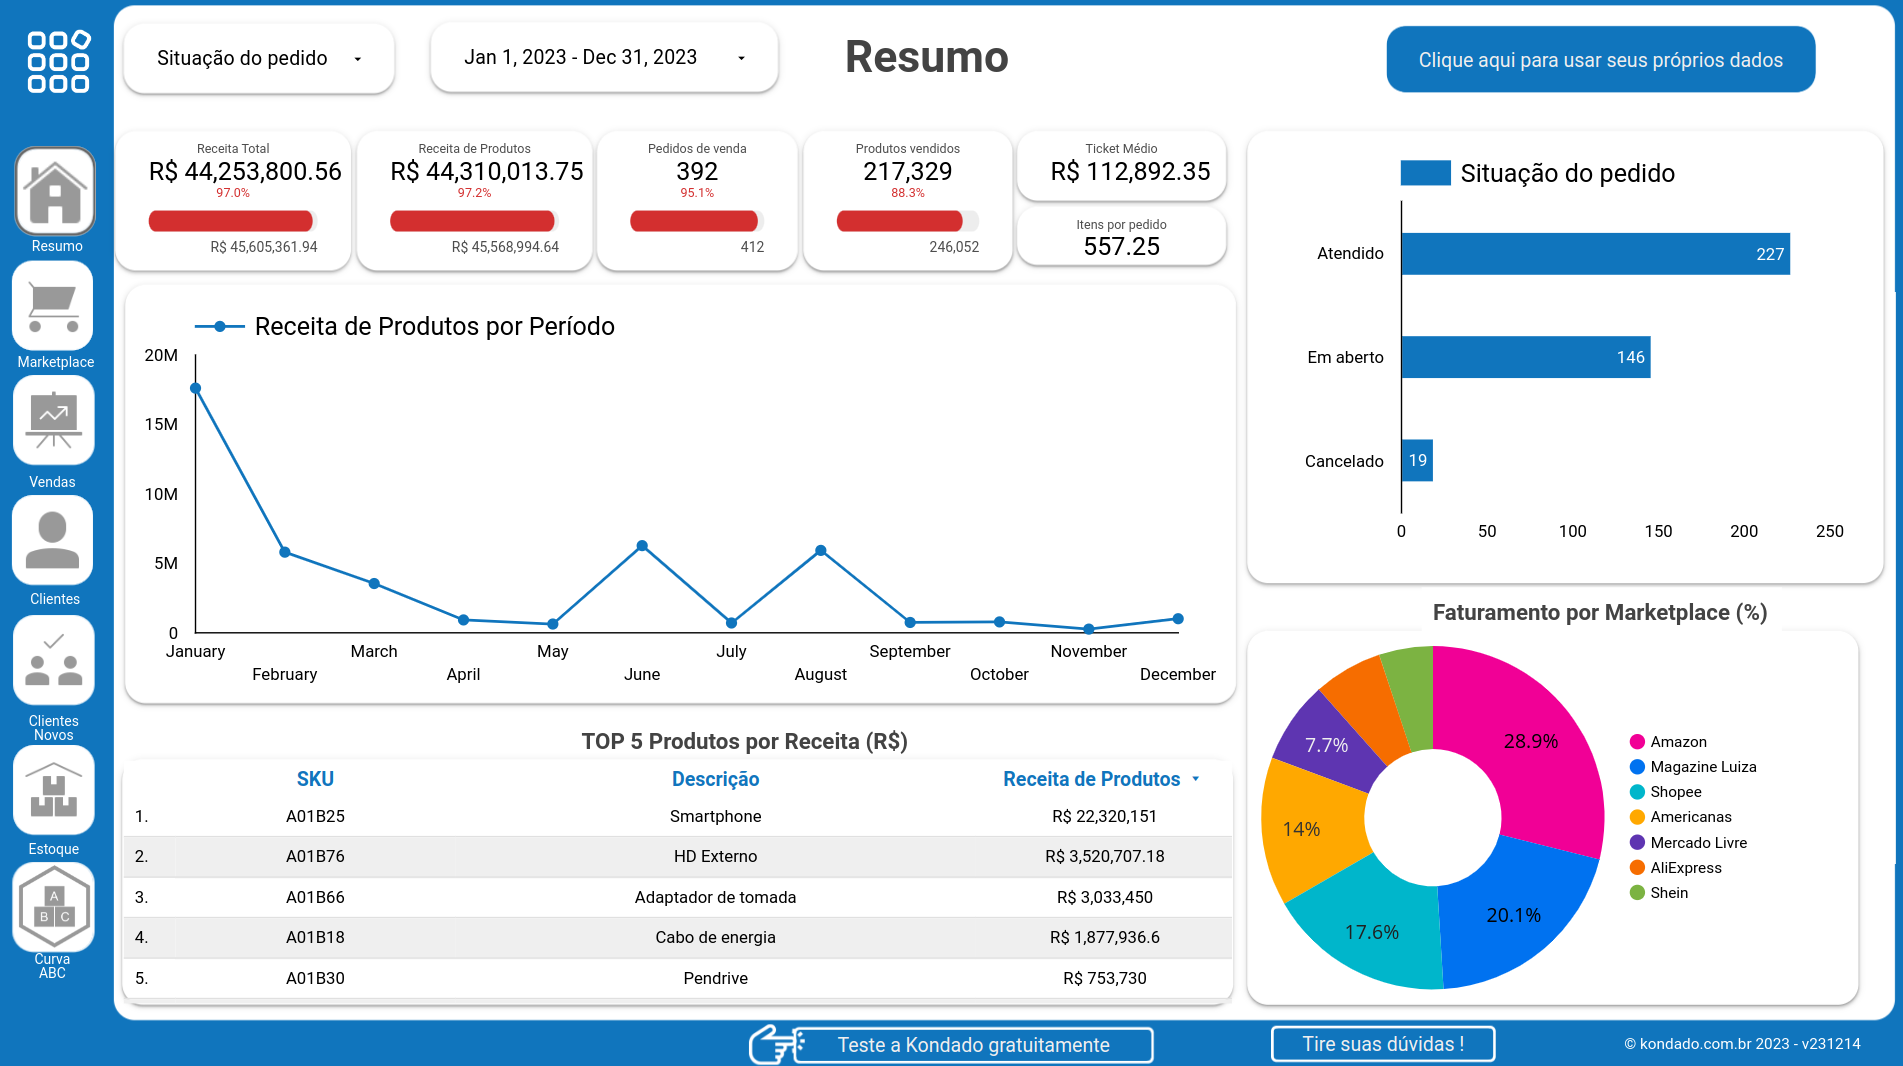
Average Ticket Metric on the Tiny Report in Looker Studio

Get started for free

No credit card required | 14 days | 10 million records | 30 pipelines

sso google logo
Sign up with Google
sso facebook logo
Sign up with Facebook
sso microsoft logo
Sign up with Microsoft
sso linkedin logo
Sign up with Linkedin

or sign up with your email

By signing up, you agree to Kondado’s Terms of service and Privacy policy

dashboard-tiny-looker-studio-ticket-medio
Understand the average amount spent by your customers in the Average Ticket chart on the Tiny Report in Looker Studio created by Kondado. Use this metric to define strategies and improve profitability. Integrate your Tiny data with Kondado and maximize your profits

Try out all the features for free for 14 days

Exploring the insights of the Tiny Report

Hundreds of data-driven companies trust Kondado
arezzo
brf
Contabilizei
dpz
fiocruz
grupo_soma
inpress
multilaser
olist
unimed
v4_company
yooper

Discover the advantages of using the Tiny ERP report created by Kondado

How to analyze this chart

Step-by-step guide to extract insights from your dashboard

1
Create your free account

Sign up for Kondado in seconds. No credit card required.

2
Connect your data source

Authenticate your tool with just a few clicks.

3
Visualize your data

Access ready-made dashboards or create your own.

Frequently Asked Questions

Answers about dashboards and data visualization

How does data updating work?
Data is updated automatically - hourly, daily, weekly, or every 5 minutes.
Can I customize the dashboards?
Yes! All dashboards are fully editable.
Do I need to know how to code?
No! Kondado was built for marketing, BI, and operations teams.
How much does it cost?
Our plans start at $19/month. Try free for 14 days - no credit card required.
Do you offer professional services?
Yes! We offer setup services, dashboard customization, and BI consulting. Contact us to learn more.