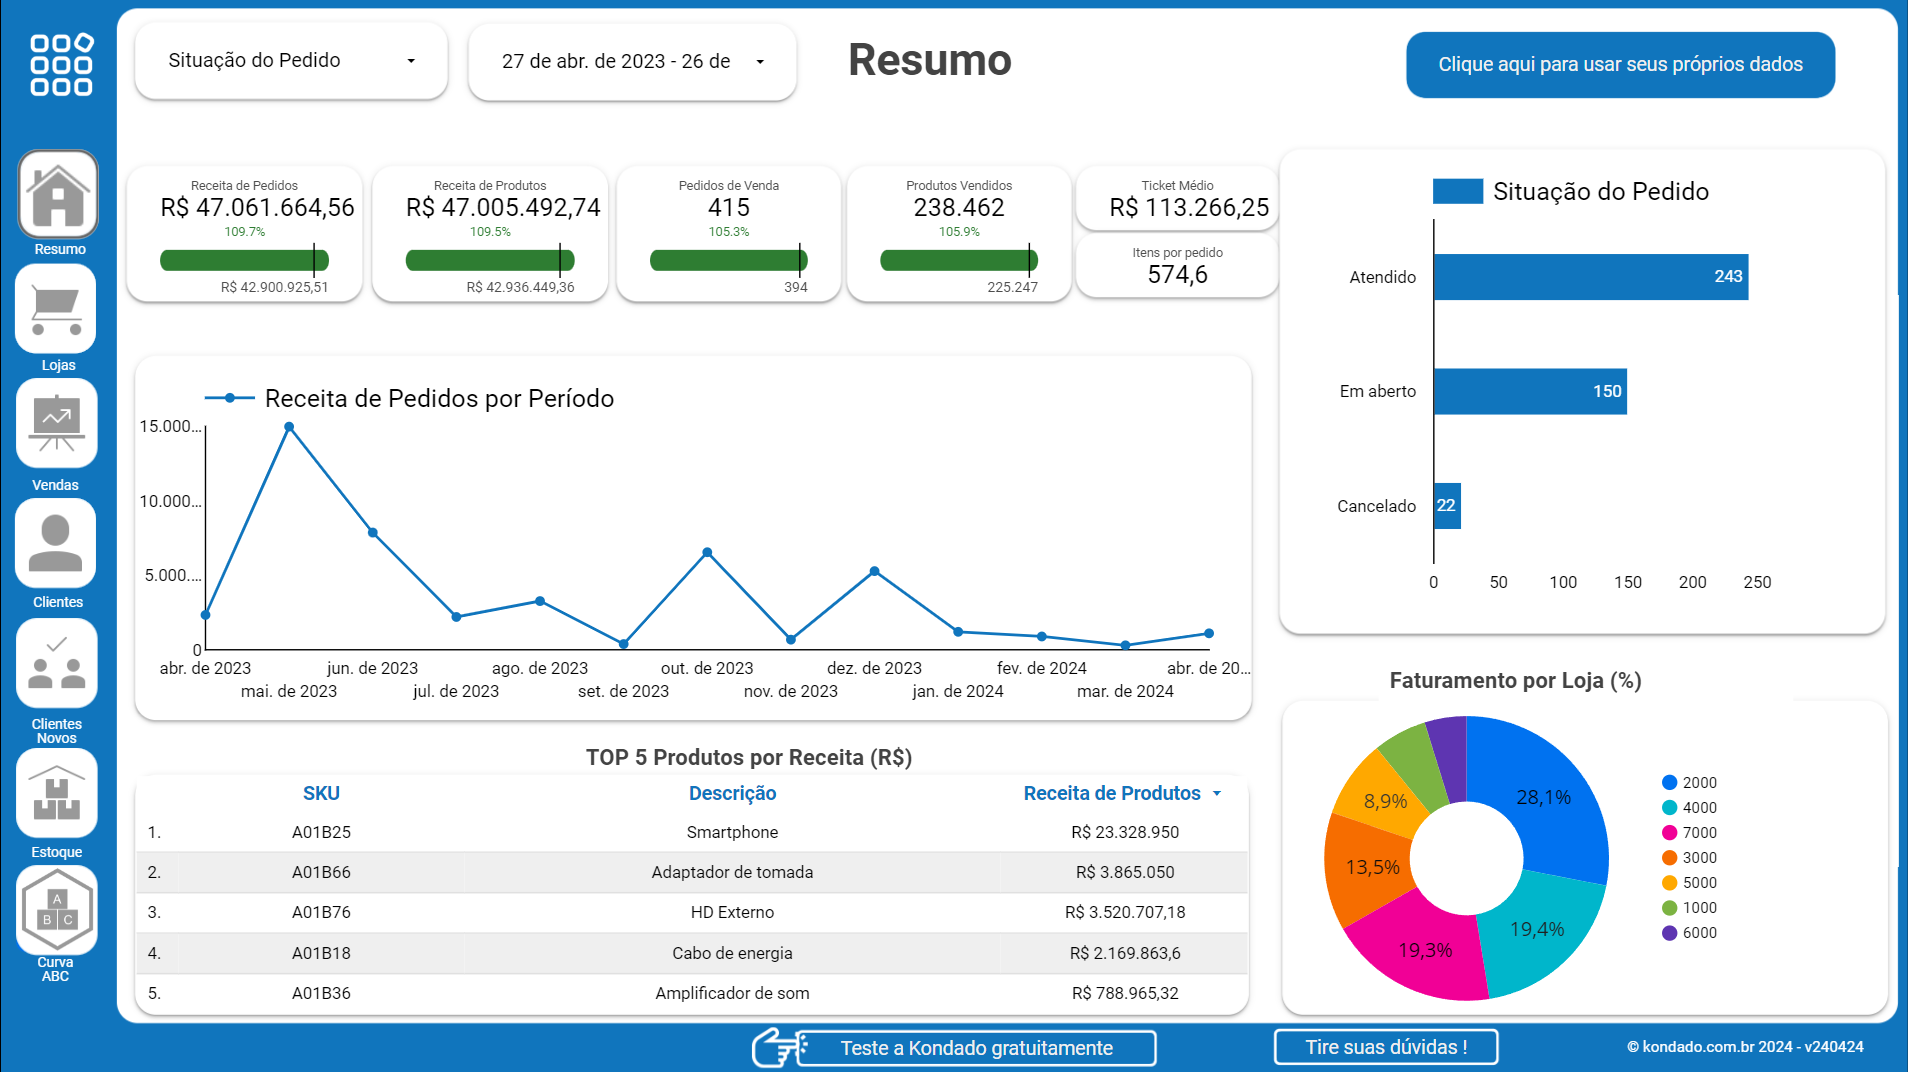
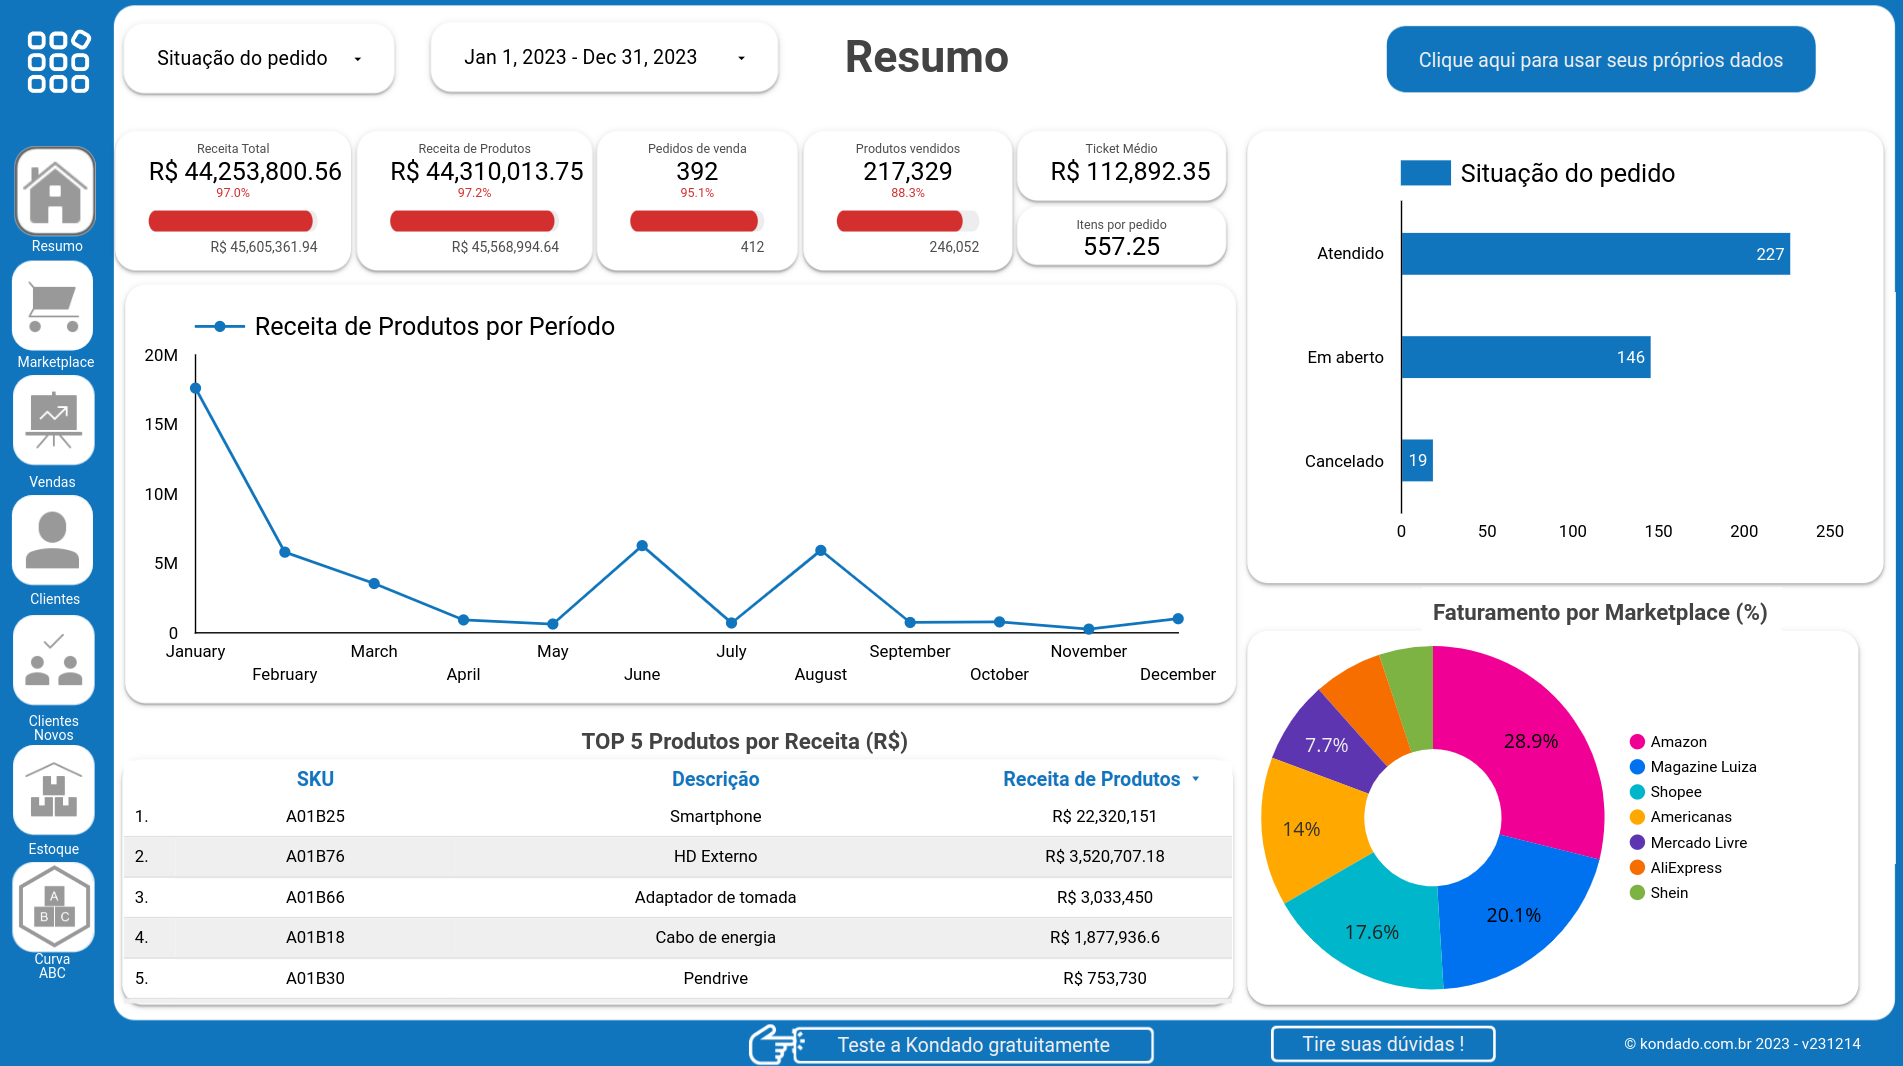
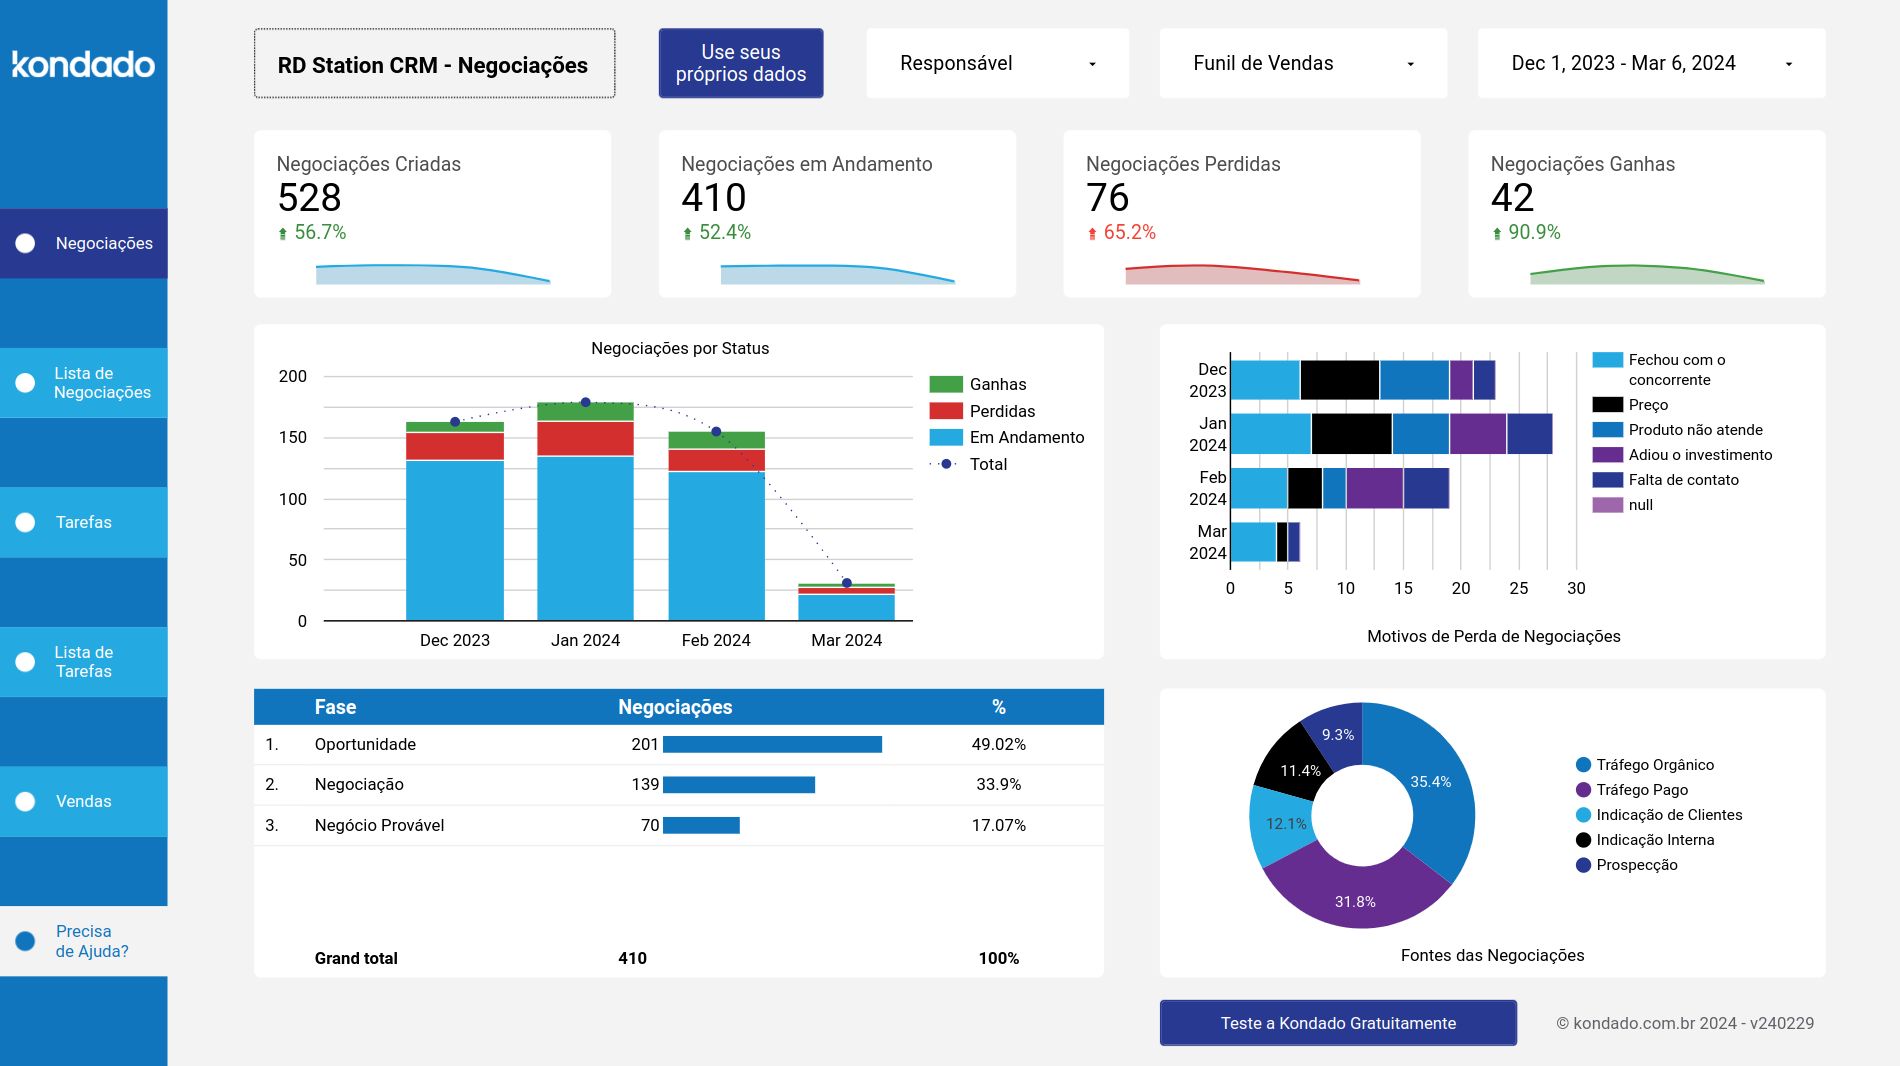
Which CRM and ERP data sources work with Data Studio through Kondado?
▼
Kondado supports over 80 data sources including popular CRMs like Salesforce, HubSpot, and Pipedrive, plus ERPs such as SAP and NetSuite. You can replicate data from these systems directly into Data Studio pipelines without technical configuration. Each data source offers selectable pipelines so you choose exactly which customer, deal, or inventory information to visualize.
How often does my Data Studio dashboard update with new data?
▼
You control the update frequency based on your business needs, choosing intervals from every five minutes to daily updates. This configurable schedule ensures your Data Studio reports reflect recent activity without manual refreshing. Marketing teams often select hourly updates for campaign monitoring, while financial reports may sync daily.
Can I use pre-built report templates for common business metrics?
▼
Yes, Kondado provides report templates designed for common use cases like e-commerce analytics, marketing attribution, and sales funnel tracking. These templates connect directly to your replicated data and display ready-made charts in Data Studio within minutes. You can customize colors, filters, and date ranges to match your brand and specific KPIs.
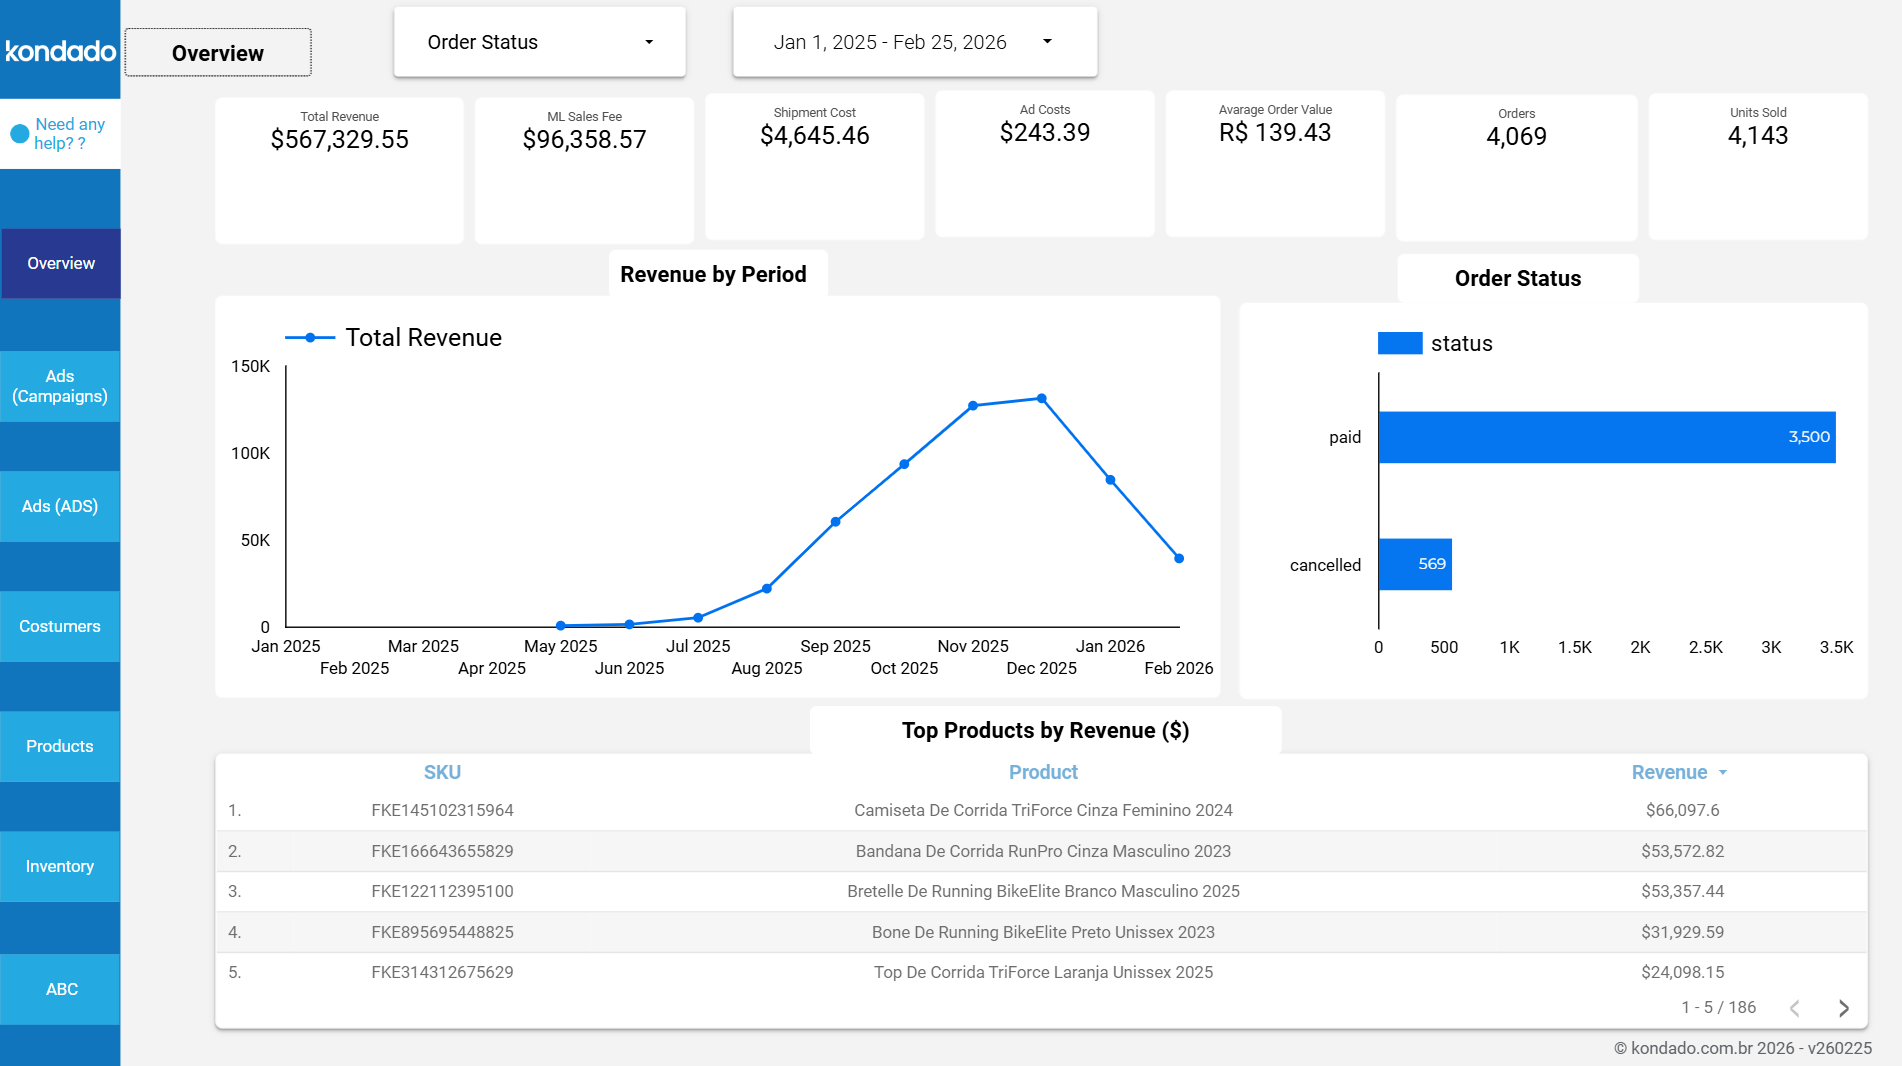
Do I need technical skills to connect my Shopify or WooCommerce store to Data Studio?
▼
No technical expertise is required to connect e-commerce platforms like Shopify, WooCommerce, or Magento to Data Studio through Kondado. Simply authenticate your store credentials in our interface, select which order and product pipelines to replicate, and your data appears in Data Studio automatically. The entire setup process takes minutes and requires no coding or API knowledge.
How do I share Data Studio reports with my marketing team?
▼
Data Studio offers built-in sharing features that let you invite team members via email or generate shareable links with view or edit permissions. You can also schedule automated email delivery of PDF reports to stakeholders who prefer offline access. Kondado keeps the underlying data updated on your configured schedule so shared reports always show current metrics.
What types of charts and visualizations can I create in Data Studio with Kondado data?
▼
Data Studio supports interactive bar charts, line graphs, pie charts, scorecards, and geographic maps using your Kondado data. You can create drill-down filters that let users click through from summary views to detailed transaction records. Advanced features include calculated fields for custom metrics like blended cost-per-acquisition across multiple advertising sources.
Can I combine data from Facebook Ads and Google Ads in one Data Studio report?
▼
Absolutely, Kondado enables you to replicate data from Facebook Ads, Google Ads, TikTok Ads, and other platforms simultaneously into Data Studio. You can build unified reporting views that compare spend, impressions, and conversions across all channels in single charts or side-by-side scorecards. This cross-platform visibility helps identify which advertising investments drive the best results for your business.
How do I connect my Salesforce data to Data Studio using Kondado?
▼
Start by selecting Salesforce from Kondado's data source catalog and authenticating with your account credentials. Choose specific pipelines such as Opportunities, Accounts, or Leads to replicate into Data Studio on your preferred schedule. Within minutes, your Salesforce records become available as fields to drag and drop into Data Studio charts and filters.


'%3E%3Cpath d='M51,41a9.978,9.978,0,0,0-7.857,3.835L22.648,34.588a9.69,9.69,0,0,0,0-5.176l20.5-10.247a10.1,10.1,0,1,0-1.791-3.577L20.857,25.835a10,10,0,1,0,0,12.33L41.352,48.412A9.994,9.994,0,1,0,51,41Z' fill='%23383e51'%3E%3C/path%3E%3C/g%3E%3C/svg%3E)
'%3E%3Cpath d='M33,47.645V60.71c.024-.014.05-.018.073-.033l11-7A2,2,0,0,0,45,51.992V40.012Z' fill='%23383e51'%3E%3C/path%3E%3Cpath d='M31,47.645,19,40.011V51.992a2,2,0,0,0,.927,1.688l11,7c.023.015.049.019.073.033Z' fill='%23383e51'%3E%3C/path%3E%3Cpath d='M32,21.693l12-7.634L33.076,7.086a2,2,0,0,0-2.152,0L20,14.059Z' fill='%23383e51'%3E%3C/path%3E%3Cpath d='M12,35.556,0,27.922V39.9A2,2,0,0,0,.927,41.59l11,7c.023.014.049.019.073.033Z' fill='%23383e51' data-color='color-2'%3E%3C/path%3E%3Cpath d='M52,35.556l12-7.634V39.9a2,2,0,0,1-.927,1.687l-11,7c-.023.014-.049.019-.073.033Z' fill='%23383e51' data-color='color-2'%3E%3C/path%3E%3Cpath d='M47,38.914a2,2,0,0,0-.924-1.686L38,32.074V27.922l12,7.634V48.621c-.024-.014-.05-.019-.073-.033L47,46.726Z' fill='%23383e51' data-color='color-2'%3E%3C/path%3E%3Cpath d='M13,33.821l12-7.634L14.076,19.214a2,2,0,0,0-2.152,0L1,26.187Z' fill='%23383e51' data-color='color-2'%3E%3C/path%3E%3Cpath d='M17,38.914a2,2,0,0,1,.924-1.686L26,32.074V27.922L14,35.556V48.621c.024-.014.05-.019.073-.033L17,46.726Z' fill='%23383e51' data-color='color-2'%3E%3C/path%3E%3Cpath d='M32,45.91l12-7.634L33.076,31.3a2,2,0,0,0-2.152,0L20,38.276Z' fill='%23383e51'%3E%3C/path%3E%3Cpath d='M14.076,19.214a2,2,0,0,0-2.152,0L1,26.187l12,7.634,12-7.634Z' fill='%23383e51' data-color='color-2'%3E%3C/path%3E%3Cpath d='M49.924,19.214a2,2,0,0,1,2.152,0L63,26.187,51,33.821,39,26.187Z' fill='%23383e51' data-color='color-2'%3E%3C/path%3E%3Cpath d='M26,27.922,14,35.556V48.621c.024-.014.05-.019.073-.033L17,46.726V38.914a2,2,0,0,1,.924-1.686L26,32.074Z' fill='%23383e51' data-color='color-2'%3E%3C/path%3E%3Cpath d='M27.076,25.138A2,2,0,0,1,28,26.824V30.8l1.848-1.179A4,4,0,0,1,31,29.123V23.428L19,15.794v4.19Z' fill='%23383e51'%3E%3C/path%3E%3Cpath d='M36.924,25.138A2,2,0,0,0,36,26.824V30.8l-1.848-1.179A4,4,0,0,0,33,29.123V23.428l12-7.634v4.19Z' fill='%23383e51'%3E%3C/path%3E%3Cpath d='M33.076,31.3a2,2,0,0,0-2.152,0L20,38.276,32,45.91l12-7.634Z' fill='%23383e51'%3E%3C/path%3E%3C/g%3E%3C/svg%3E)
'%3E%3Cpath d='M50.348,42.573c0-9.411-8.691-12.336-16.348-14.416v-16.1a32.837,32.837,0,0,1,9.363,1.656l2.778,1.11,2.228-5.57L45.584,8.134A38.043,38.043,0,0,0,34,6.046V1H30V6.081c-8.213.594-16.348,4.86-16.348,13.471,0,9.036,8.841,11.732,16.348,13.744V50.074a33.591,33.591,0,0,1-12.006-2.511l-2.683-1.341-2.684,5.367,2.684,1.342c.243.121,5.7,2.792,14.689,3.152V63h4V56.065C44,55.462,50.348,50.3,50.348,42.573Zm-30.7-23.021c0-5.133,5.96-7.016,10.348-7.446V27.071C23.512,25.243,19.652,23.535,19.652,19.552ZM34,50.043V34.393c6.5,1.882,10.348,3.761,10.348,8.18C44.348,48.377,37.873,49.744,34,50.043Z' fill='%23383e51'%3E%3C/path%3E%3C/g%3E%3C/svg%3E)