Connect Olist Tiny to Power BI: Dashboards in Minutes

Get started for free

No credit card required | 14 days | 10 million records | 30 pipelines

sso google logo
Sign up with Google
sso facebook logo
Sign up with Facebook
sso microsoft logo
Sign up with Microsoft
sso linkedin logo
Sign up with Linkedin

or sign up with your email

By signing up, you agree to Kondado’s Terms of service and Privacy policy

Olist Tiny
Power BI

Visualize Olist Tiny Data in Power BI

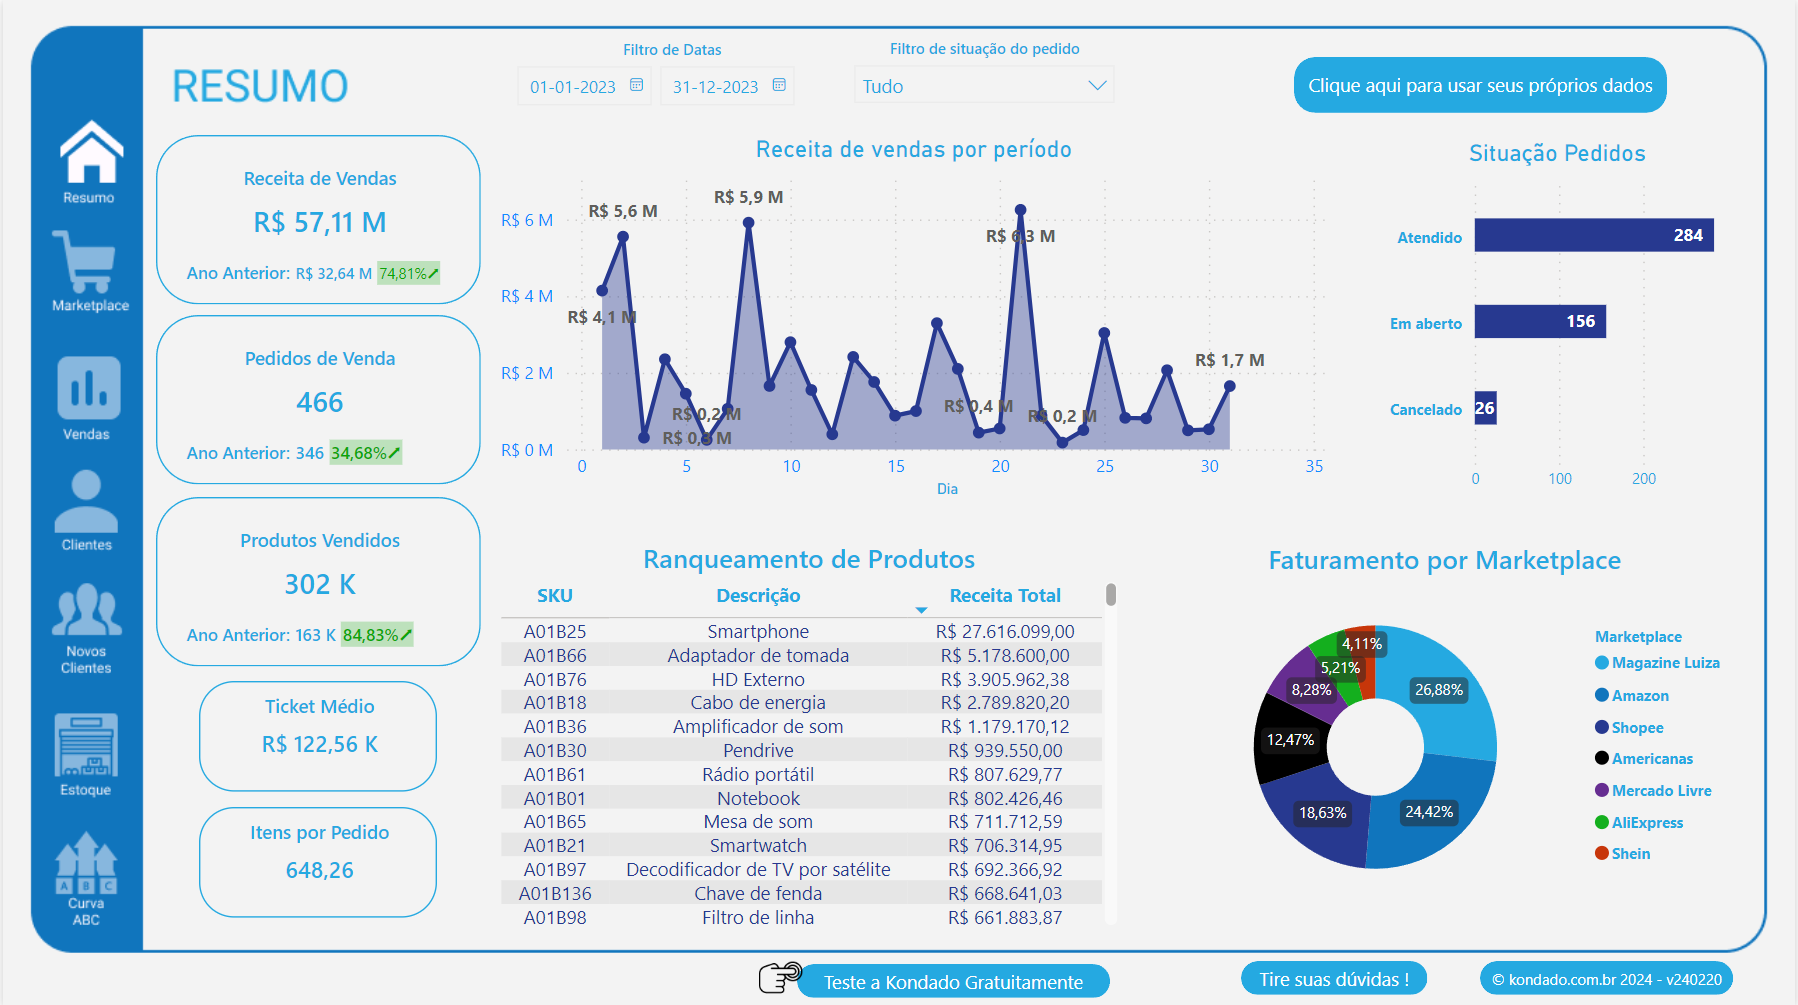
Connecting your ERP data to business intelligence is simple with Kondado. Start by selecting Olist Tiny as your data source and choose Power BI as your destination. Within minutes, your orders, inventory levels, and financial records become interactive charts and graphs that help you track business performance without any technical setup or coding requirements.

Configure your data to refresh on a schedule that fits your operations, whether you need near-real-time updates every few minutes or consolidated daily summaries. This flexibility ensures your sales dashboards and financial reports always display current information, enabling your team to identify trends in marketplace performance and make informed decisions about stock levels or payment collections quickly.

Kondado connects Olist Tiny directly to Power BI with 15 available pipelines covering 792 fields including Orders, Accounts Receivable, and Product Stock, enabling automated report updates on a configurable schedule without intermediate databases or complex configuration.

Our prices start from $19 USD/month, and you can try Kondado for free for 14 days with no credit card required

Combining your Olist Tiny ERP information with Power BI visualization capabilities creates immediate operational visibility for your online store or retail business. By accessing pipelines such as Order Details, Accounts Receivable, and Product Stock, you can build comprehensive dashboards that connect sales volume with available inventory and outstanding payments. Track which products generate the most revenue while monitoring current cash flow health, or analyze order patterns across different marketplaces to optimize purchasing decisions and identify your most profitable sales channels without manual spreadsheet work.

Try out all the features for free for 14 days

Olist Tiny data available in Power BI

15
available pipelines
792
extractable fields

Available integrations

Integration Description
CRM Issues Includes fields such as assunto_id, assunto_cliente, and assunto_data_acao, enabling tracking of the stage and status of each issue in the CRM.
CRM Issues Details Presents detailed information such as cliente_codigo, cliente_nome, and cliente_cidade, providing a comprehensive view of issues and their respective clients.
Accounts Payable Contains data such as id, data_emissao, and valor, allowing effective management of accounts payable and their respective statuses.
Accounts Receivable Includes information on receivables such as id, data_emissao, and saldo, facilitating the tracking of revenues to be received.
Contacts Presents data such as cliente_id_cliente, cliente_nome, and cliente_email, allowing effective management of contacts and their information.
Accounts Payable Details Includes fields such as id, data_vencimento, and historico, providing a detailed view of accounts payable and their conditions.
Accounts Receivable Details Presents information such as id, data_vencimento, and saldo, allowing detailed control of accounts receivable.
Invoice Details Includes fields such as id, numero_doc, and data_emissao, providing a detailed view of issued invoices.
Invoice Details: XML Presents information in XML format, including fields such as id and xml_data, allowing technical analysis of invoices.
Order Details Includes fields such as id, data_pedido, and valor_total, providing a comprehensive view of orders placed.
Product Stock Contains information about the available quantity of products, including fields such as id, product name, and stock balance.
Invoices Records details of issued invoices, including fields such as id, issue date, and customer name.
Orders Includes information about placed orders, with fields such as id, order date, and order status.
Products Presents data about registered products, including id, name, and selling price.
Products: grid Provides a grid view of products, with fields such as id, name, and category.
CRM Issues
Includes fields such as assunto_id, assunto_cliente, and assunto_data_acao, enabling tracking of the stage and status of each issue in the CRM.
CRM Issues Details
Presents detailed information such as cliente_codigo, cliente_nome, and cliente_cidade, providing a comprehensive view of issues and their respective clients.
Accounts Payable
Contains data such as id, data_emissao, and valor, allowing effective management of accounts payable and their respective statuses.
Accounts Receivable
Includes information on receivables such as id, data_emissao, and saldo, facilitating the tracking of revenues to be received.
Contacts
Presents data such as cliente_id_cliente, cliente_nome, and cliente_email, allowing effective management of contacts and their information.
Accounts Payable Details
Includes fields such as id, data_vencimento, and historico, providing a detailed view of accounts payable and their conditions.
Accounts Receivable Details
Presents information such as id, data_vencimento, and saldo, allowing detailed control of accounts receivable.
Invoice Details
Includes fields such as id, numero_doc, and data_emissao, providing a detailed view of issued invoices.
Invoice Details: XML
Presents information in XML format, including fields such as id and xml_data, allowing technical analysis of invoices.
Order Details
Includes fields such as id, data_pedido, and valor_total, providing a comprehensive view of orders placed.
Product Stock
Contains information about the available quantity of products, including fields such as id, product name, and stock balance.
Invoices
Records details of issued invoices, including fields such as id, issue date, and customer name.
Orders
Includes information about placed orders, with fields such as id, order date, and order status.
Products
Presents data about registered products, including id, name, and selling price.
Products: grid
Provides a grid view of products, with fields such as id, name, and category.

Try out all the features for free for 14 days

Discover our Olist Tiny report in Power BI

How to create Olist Tiny dashboards in Power BI

Visualize your data automatically — no spreadsheet exports or custom scripts.

1
Connect Your Olist Tiny Account

Add Olist Tiny as a data source in Kondado and enter your authentication credentials to establish the link with your ERP system.

2
Choose Power BI as Destination

Select Power BI from the available destinations to direct your business data into Microsoft's visualization platform.

3
Configure Refresh and Visualize

Set your preferred update schedule and start building charts using the replicated data, or load one of the available report templates to accelerate your dashboard creation.

Access Olist Tiny data in Power BI and combine it with dozens of other data sources

If the source you want is not listed, drop us a chat message. We love to add new sources!

Visualize Olist Tiny data in other BI tools

If the software you need is not listed, drop us a messagem. You can use almost every tool

Hundreds of data-driven companies trust Kondado
arezzo
brf
Contabilizei
dpz
Experian
grupo_soma
inpress
multilaser
olist
unimed
v4_company
yooper

Frequently Asked Questions (FAQ)

Answers about visualizing Olist Tiny data in Power BI automatically

How do I set up Olist Tiny to send data to Power BI?
Start by adding Olist Tiny as a new data source in your Kondado account and authenticate with your credentials. Then select Power BI as the destination and choose which pipelines you want to replicate, such as Orders or Invoices. The connection activates immediately, and your selected data begins populating your Power BI workspace within minutes.
What kind of dashboards can I build with Olist Tiny data in Power BI?
You can create financial control panels tracking Accounts Payable and Receivable, sales performance views using Order Details and Invoice data, and inventory management boards showing Product Stock levels. These dashboards help you monitor cash flow, identify bestselling products, and manage reorder points across multiple sales channels. The visual format makes it easy to spot trends in your ecommerce operations that spreadsheets might hide.
How often does the data update in my Power BI reports?
You configure the update frequency based on your business needs, choosing intervals from every 5 minutes to daily schedules. This ensures your reports reflect recent transactions and inventory changes without manual refreshing. For fast-moving marketplace operations, frequent updates help you maintain accurate stock counts and payment tracking.
What specific KPIs should I track from Olist Tiny in Power BI?
Monitor Days Sales Outstanding using Accounts Receivable data to improve cash collection, track inventory turnover rates with Product Stock and Order Details pipelines, and analyze sales velocity by marketplace channel. These metrics reveal operational bottlenecks in your financial and supply chain processes. Comparing receivables aging against sales trends helps you balance growth with healthy cash flow.
Are there pre-built dashboard templates available for Olist Tiny and Power BI?
Yes, Kondado offers ready-made report templates including the Olist Tiny Power BI Report and Olist Tiny Looker Studio Report. These templates provide immediate visualizations for common ecommerce and retail metrics, saving you hours of initial setup time. You can customize these pre-built dashboards to match your specific business terminology and branding requirements.
Can I share my Olist Tiny Power BI dashboards with my team?
Once your data flows into Power BI, you can distribute reports to colleagues through standard Power BI sharing features, including email subscriptions and app workspaces. Your team members access the same current data you see, ensuring everyone bases decisions on consistent information. This collaborative approach keeps sales, finance, and operations teams aligned on daily performance metrics.
Do I need technical skills to connect Olist Tiny to Power BI?
No coding or database knowledge is required to establish the connection between your ERP and visualization tool. The setup process uses simple point-and-click configuration to select your data source and destination. Business users can manage the entire process independently without waiting for IT department assistance.
What data from Olist Tiny can I visualize in Power BI?
You can access 15 different pipelines including CRM Issues for customer service tracking, Accounts Payable Details for expense management, and Invoice Details for revenue analysis. This covers your complete business cycle from customer acquisition through financial collection. Each pipeline contains specific fields like order dates, stock balances, and payment statuses that become interactive chart elements.

Try out all the features for free for 14 days